Quicksight Analytics Dashboard
Quicksight is an AWS product that Viafoura leverages for data visualization for its customers. It connects directly to Viafoura’s data lake which updates every day (you will see the data until yesterday). You can export and filter the timeframes for the data you are looking for.
Conversations
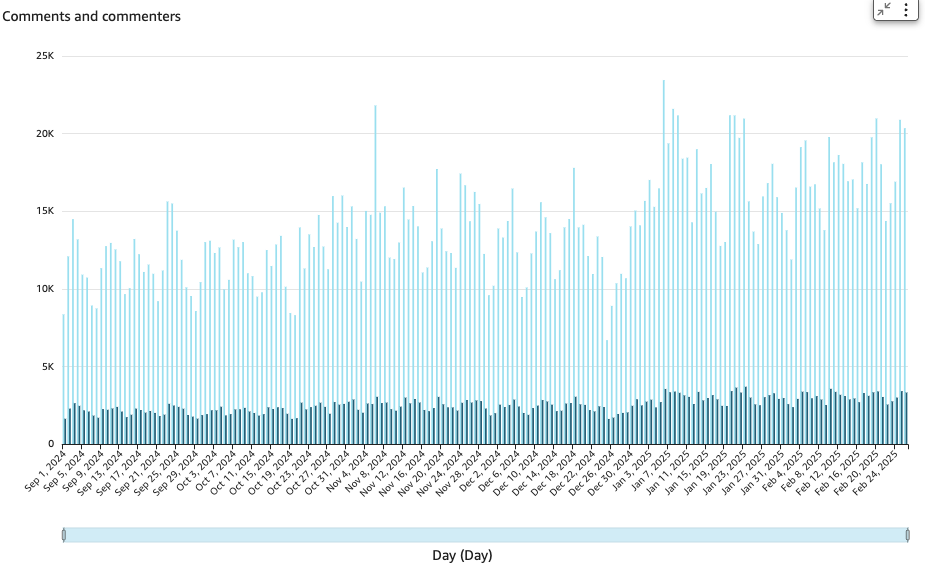
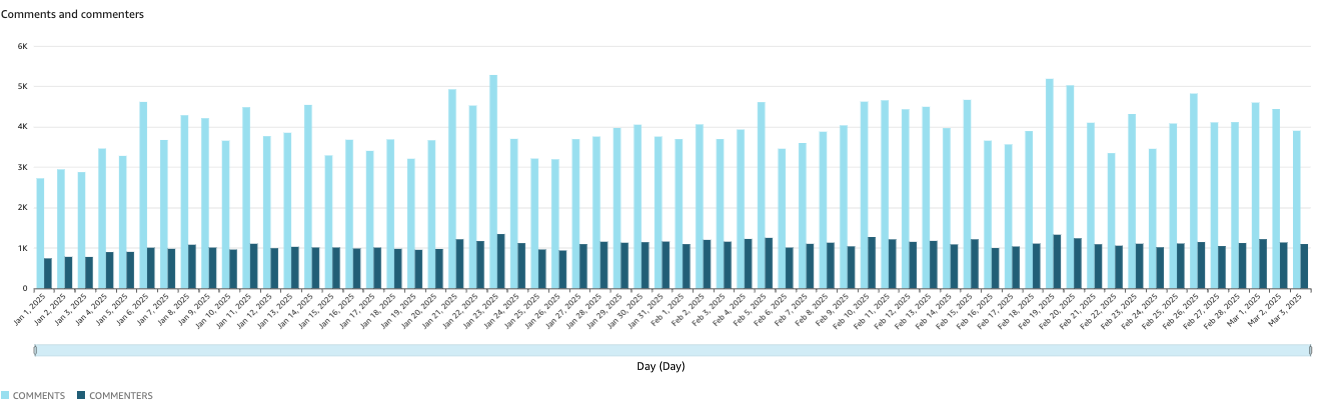
Shows unique daily comments (comments and replies) and commenters
This graph looks only at comment posting actions (not deletions)
Comments are counted on the day they are posted, not moderated.
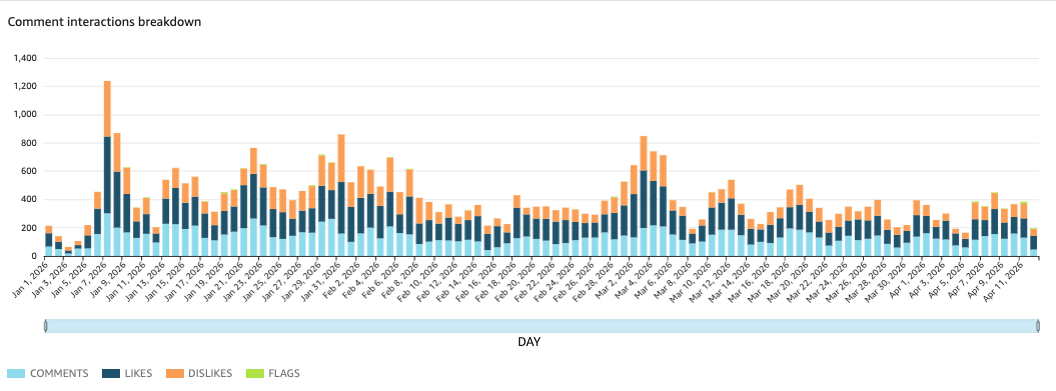
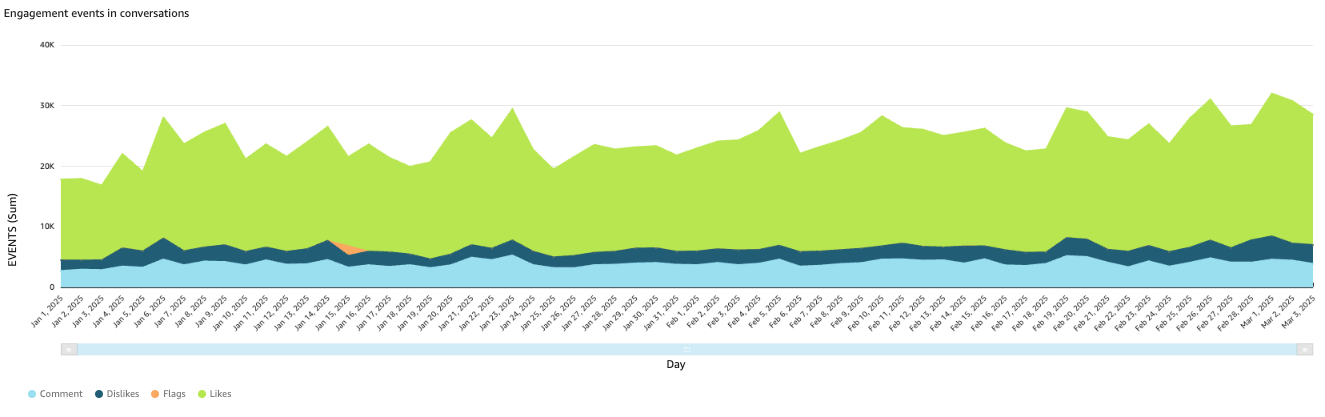
Shows unique Comments, Likes, Dislikes and Flags (Reported Comments)
Looks at created actions (not deletions)
Comments, Likes and Dislikes are counted on the day they are posted, not moderated
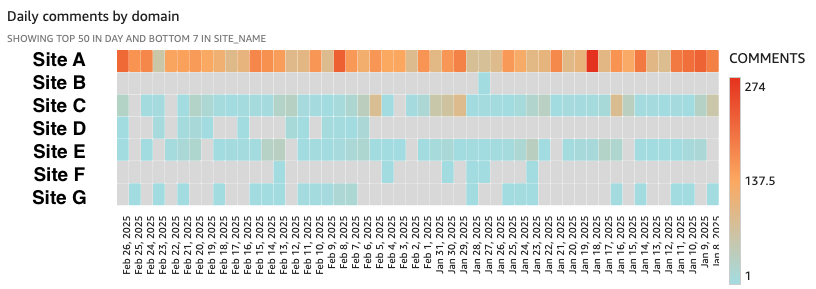
Daily comments by domain is used to compare engagement across all of your sites
You can see both the busiest site by commenting volumes but also the busiest days
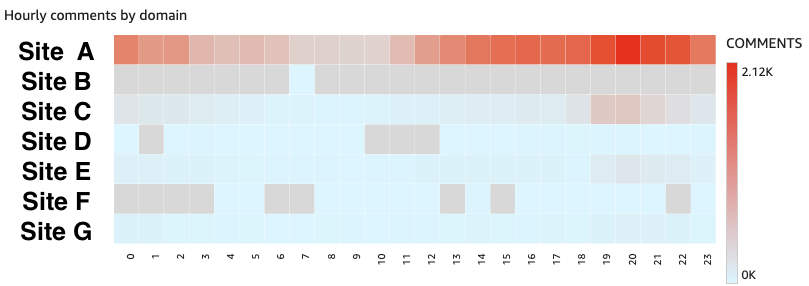
Shows the busiest period across your site for commenting
This is useful for planning live events and knowing when your community is most active
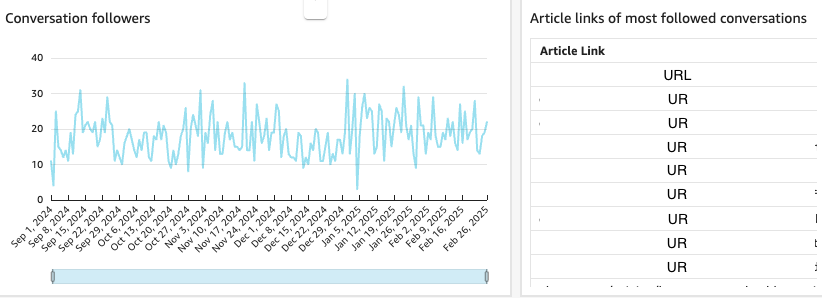
Shows daily conversations follows
This graph counts follows actions and we are not checking for "unfollow" events
The table shows the URLs with the highest follow counts
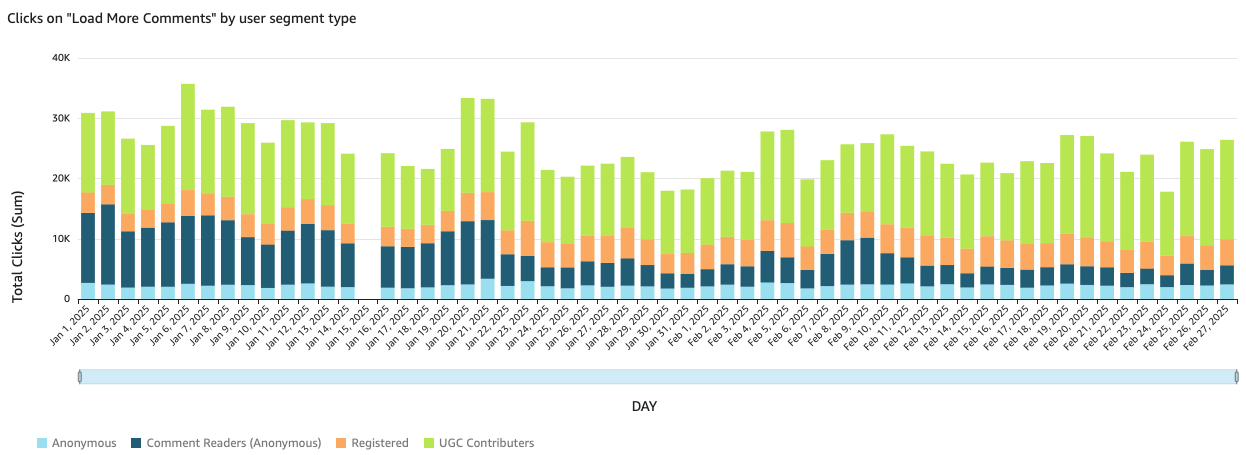
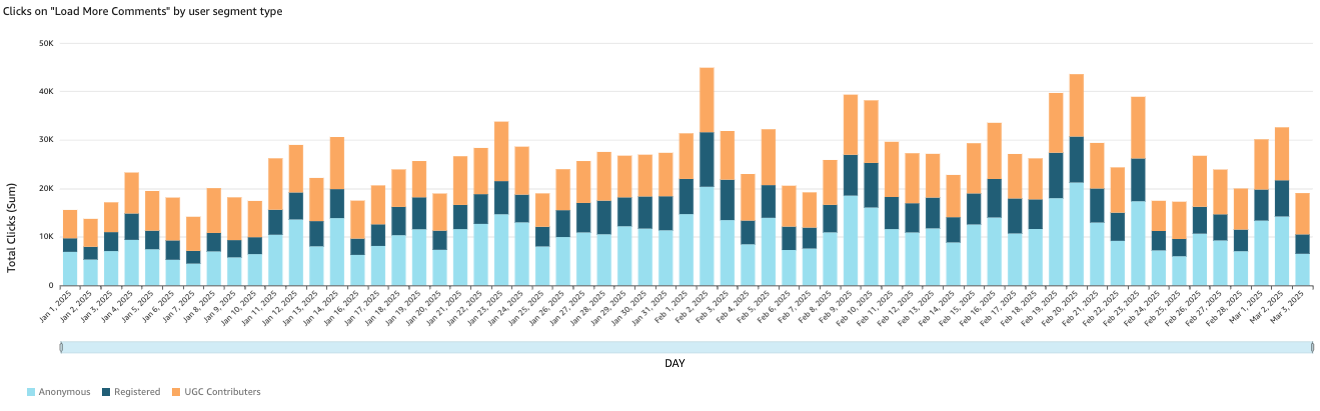
How many clicks on "load more comments" per day
This can depend on how many comments you have on initial load
The graph is broken down by segment type
Viafoura SegmentsAnonymous - Non loyal fly-by audience
Comment Readers - Also known as Active Engaged, they are now starting to spend more time in the comment section and becoming more loyal to your site
Registered - Your known audience, these users have created an account with you
UGC Contributor - A registered user who is contributing to the community
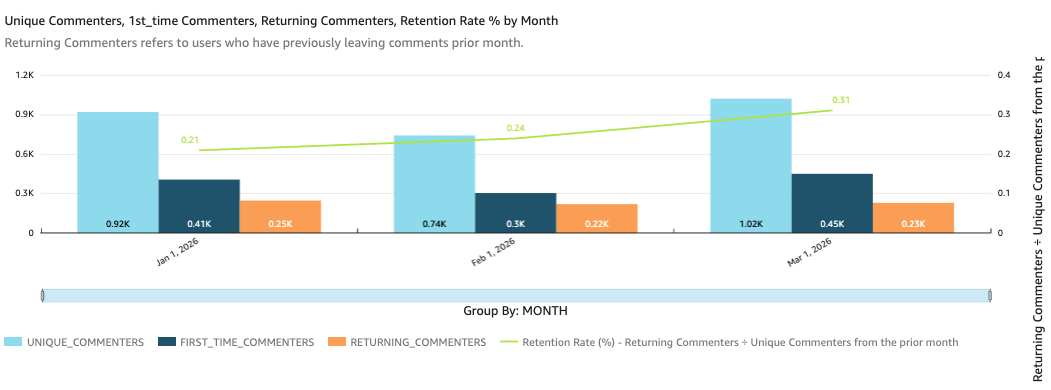
Returning Commenter Rate Month over Month. Retention Rate % is calculated by showing how many of the previous months commenters have returned and commented the following month.
Live Q&A
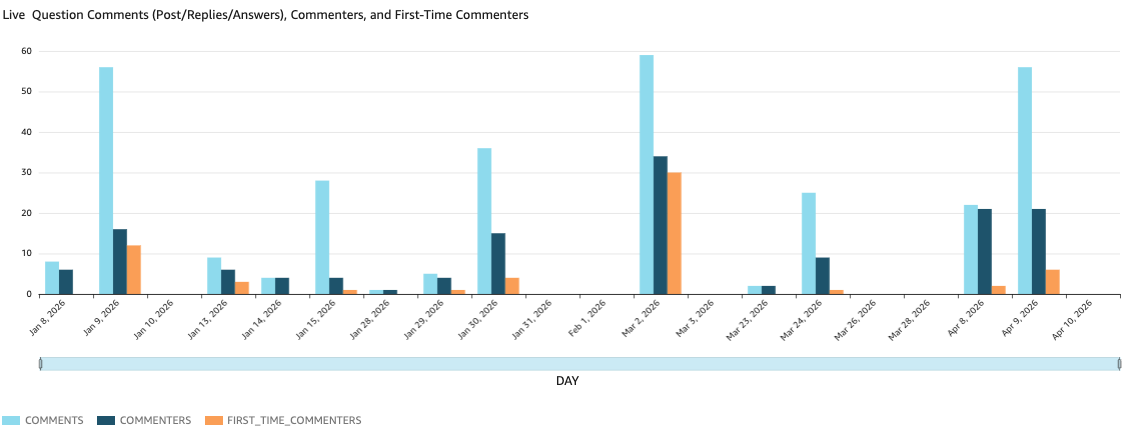
Unique Daily Comments, Commenters and First Time Commenters created exclusively in Live Q&A
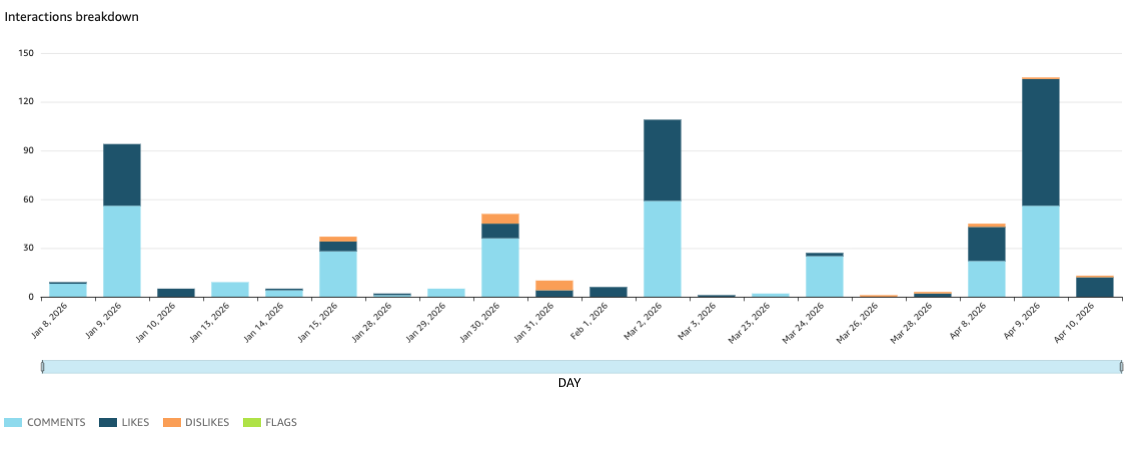
Unique Comments, Likes, Dislikes and Flags (Reported Comments) created in Live Q&A
Comments in Live Q&A = Announcements, Questions, Answers and Replies
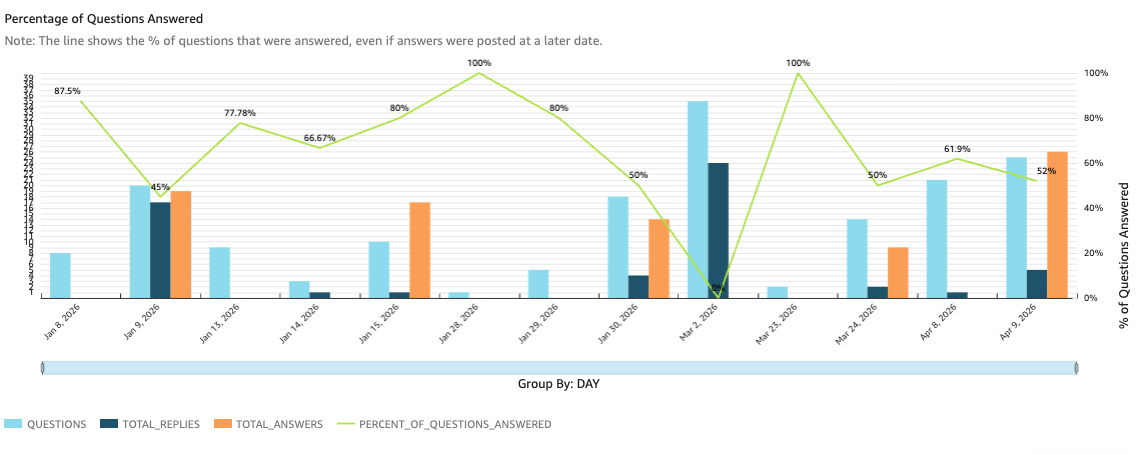
% of Questions answered out of all Questions Posed
All Questions and Answers are recorded on the date they were posted, Answers are designated responses from the hosts.
Chats, Blogs, Reviews
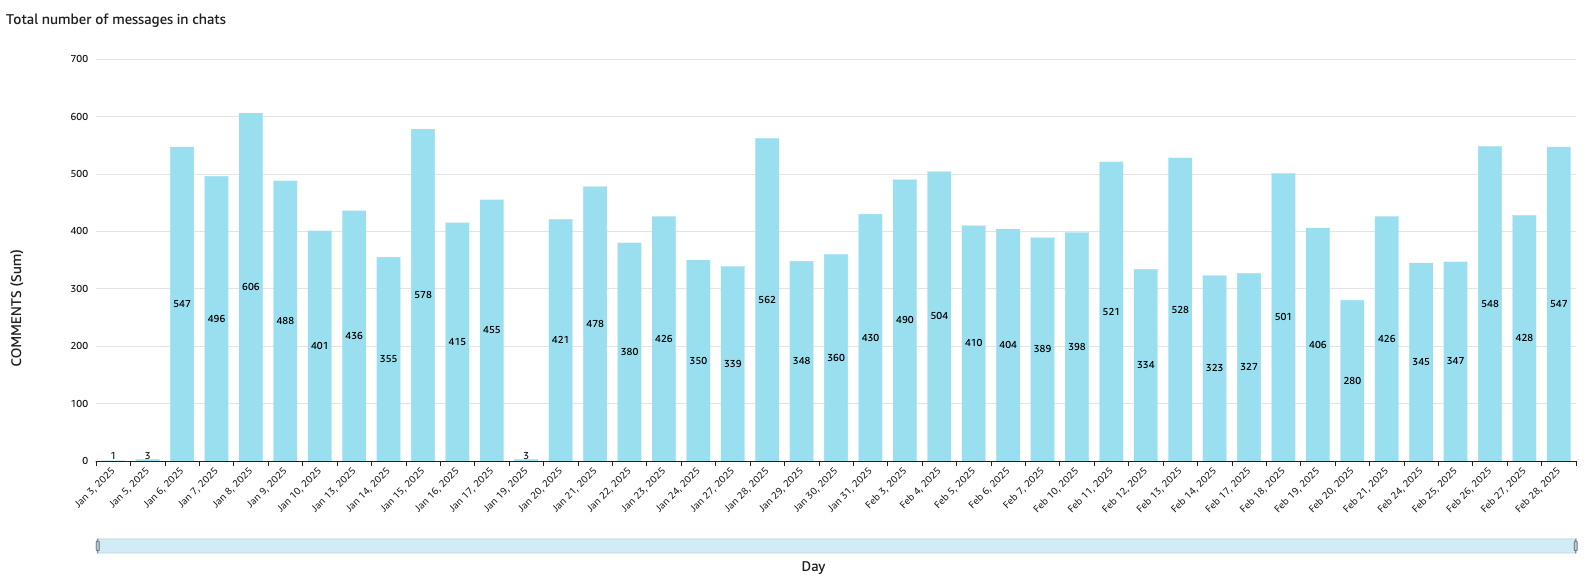
Shows unique daily messages posted in Chats
Counts the posting actions and not deleted actions
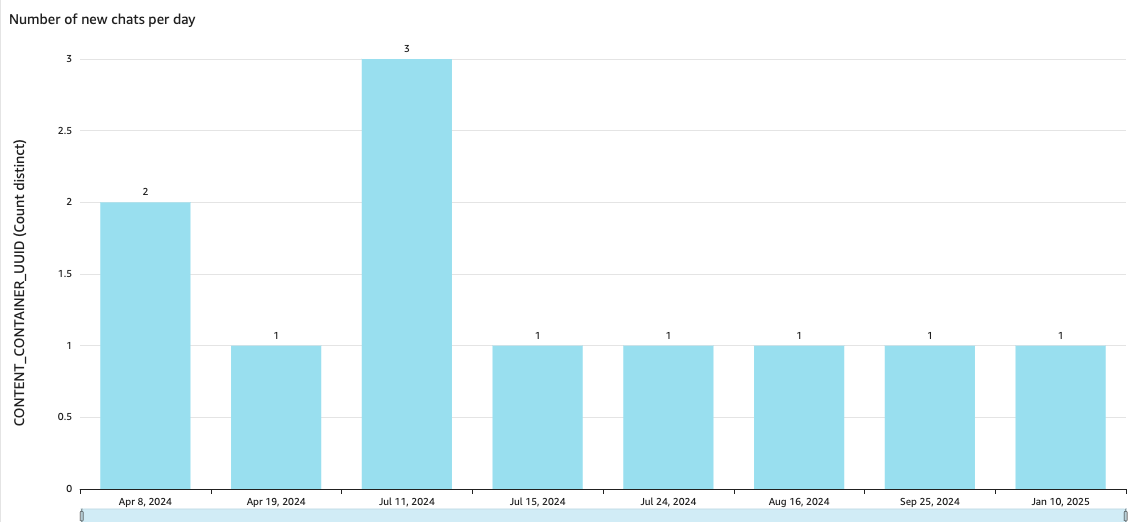
New chat containers created per day
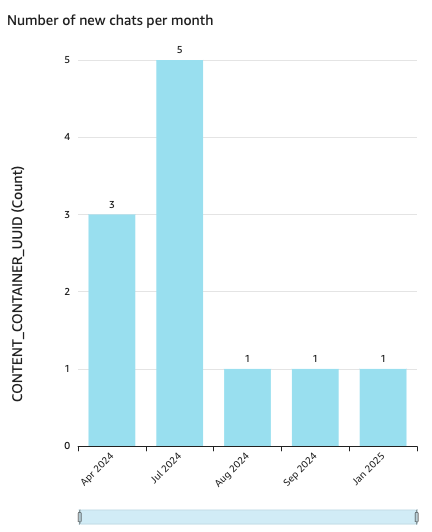
New chat containers created per month
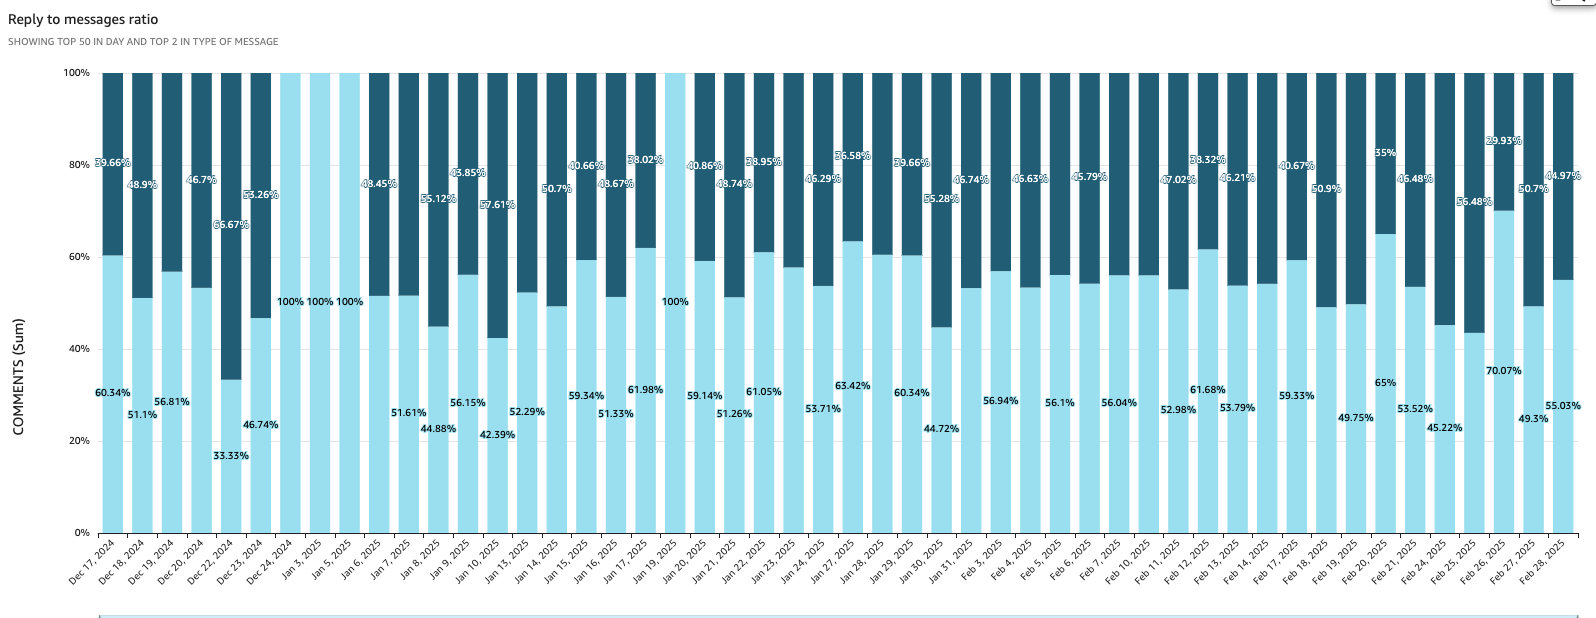
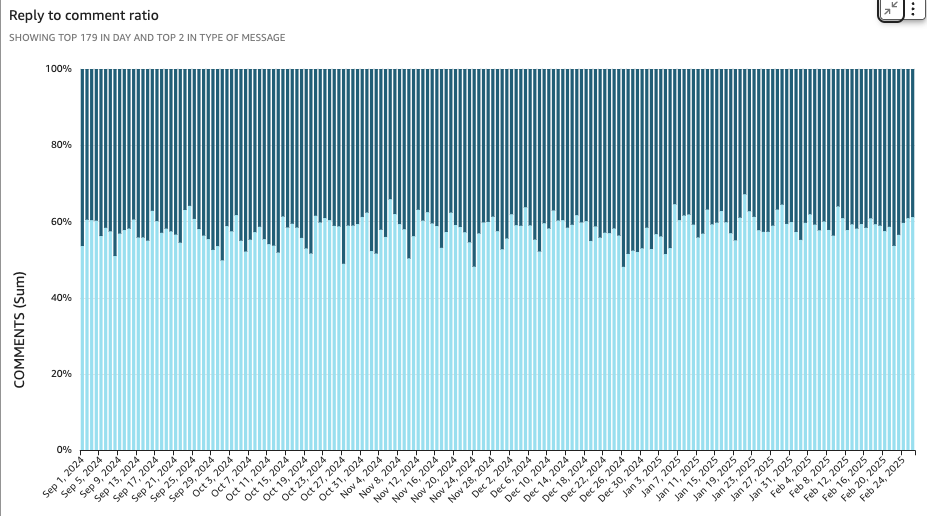
% of comments posted that are replies vs parent comments
Reply to comment ratio is usually lower in Chats than Conversations due to the fast paced nature
Blogs
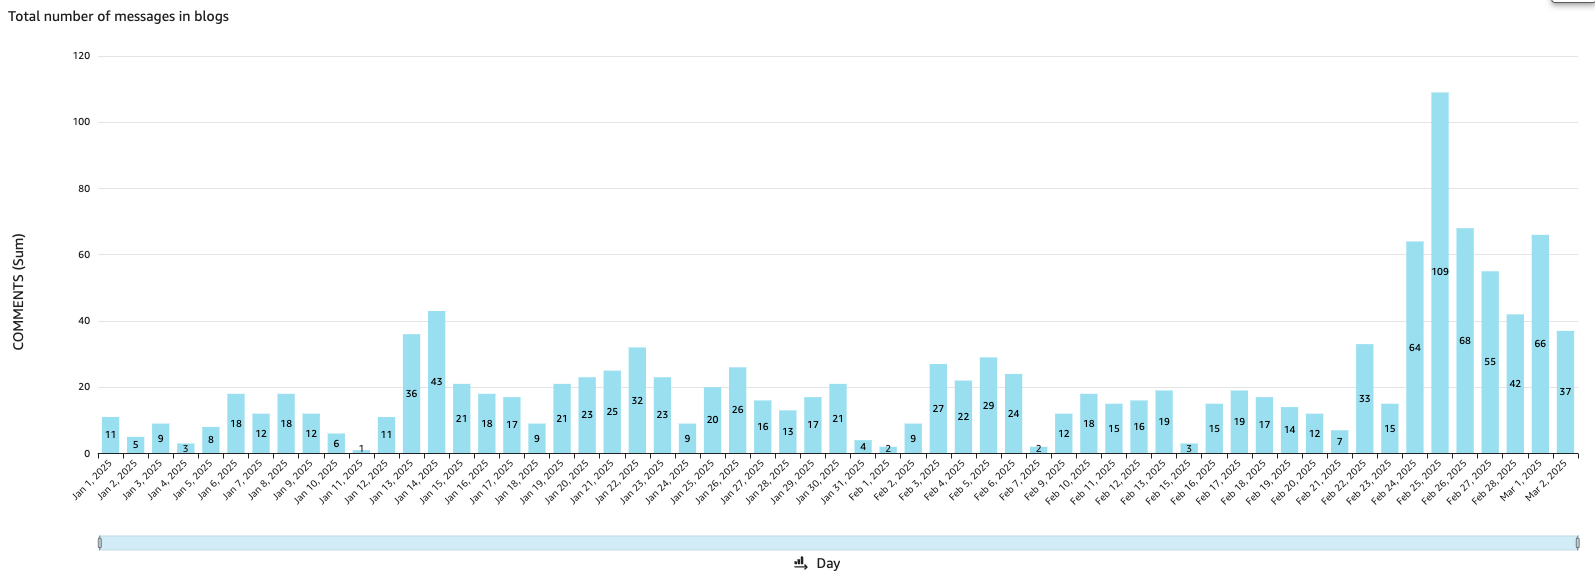
Comments includes both top level journalists post and comments from users
Comments in Liveblogs can be enabled using the front end settings panel
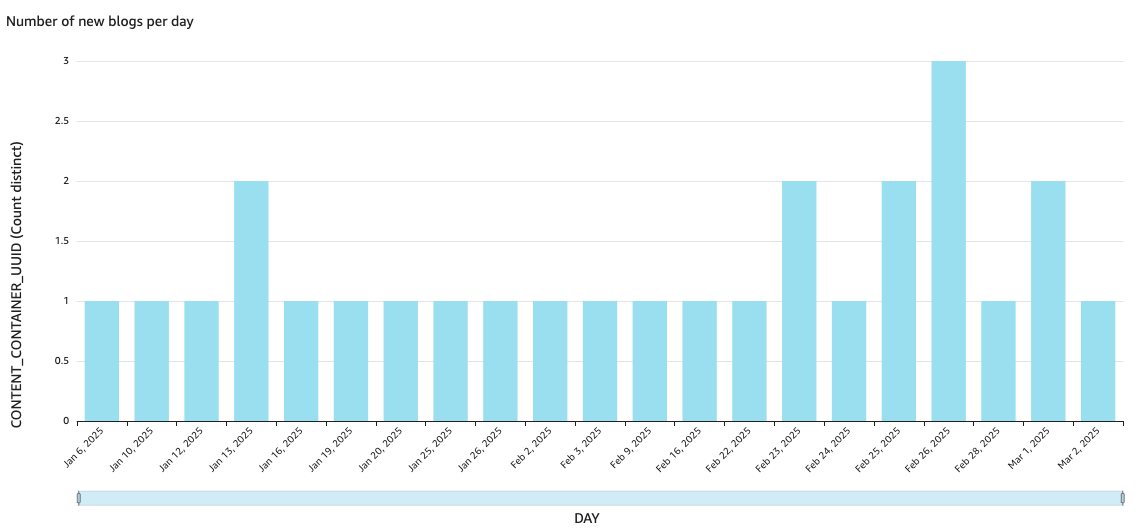
New live blog containers created per day
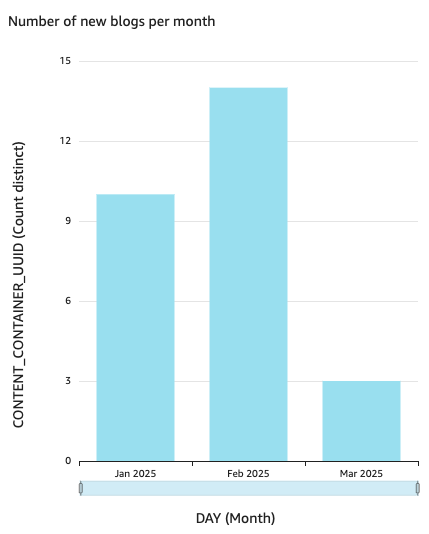
New liveblog containers created per month
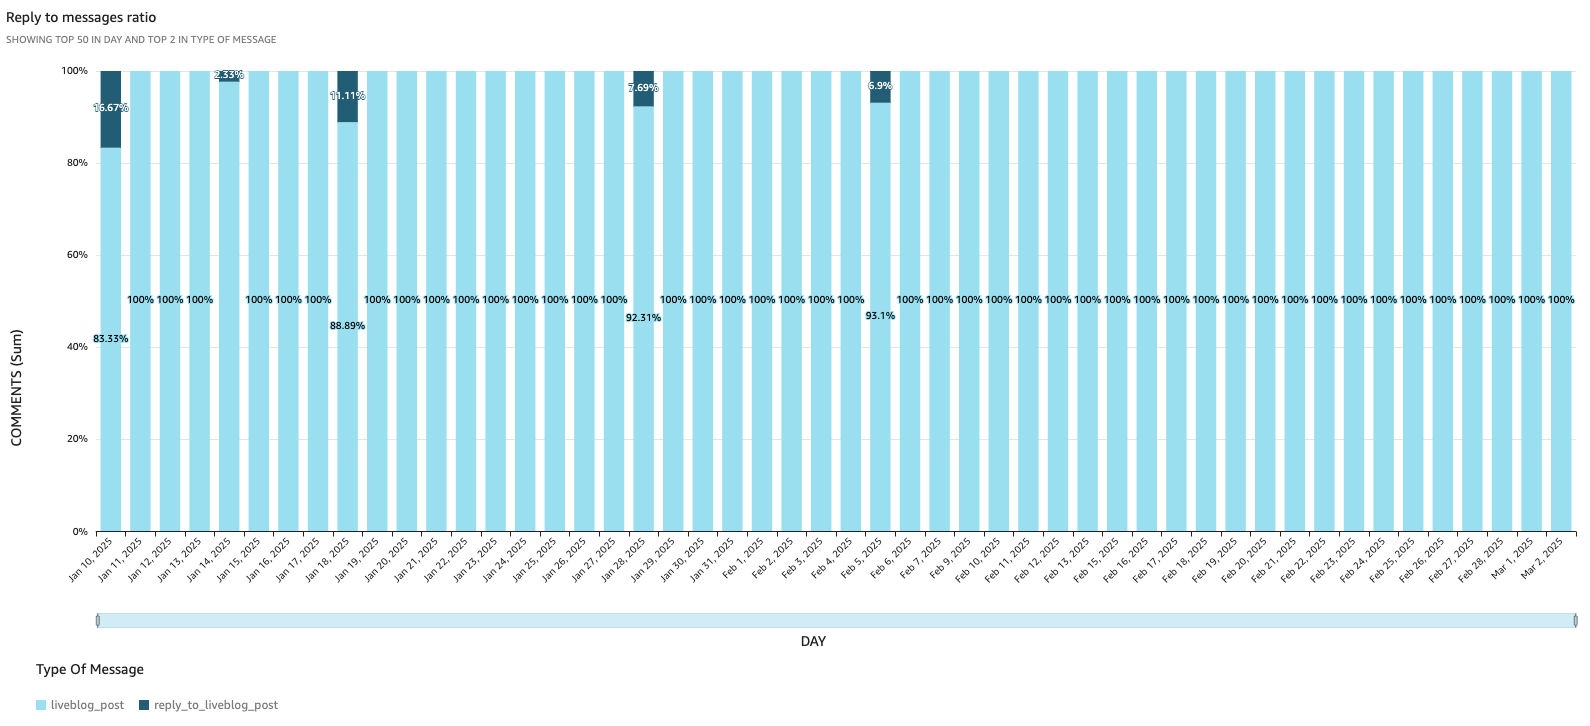
% of comments posted in Liveblogs that are parent comments vs replies
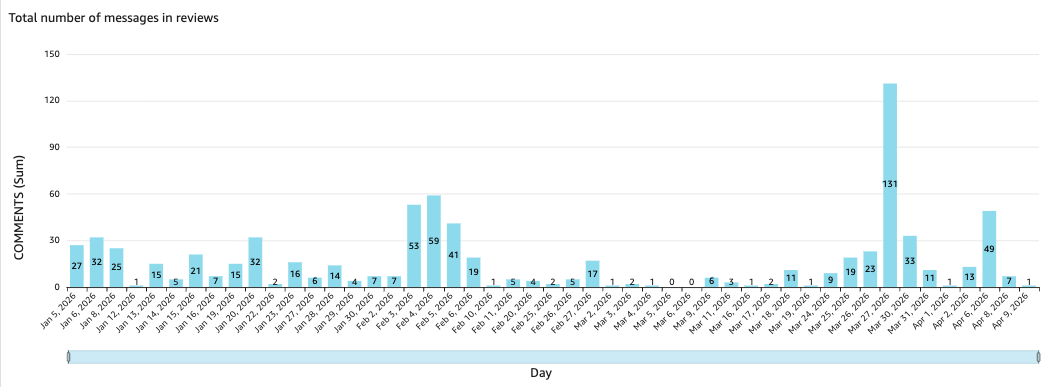
Counts unique reviews created, this graph looks only at reviews posting actions (not deletions)
Reviews are counted on the day they are posted, not moderated
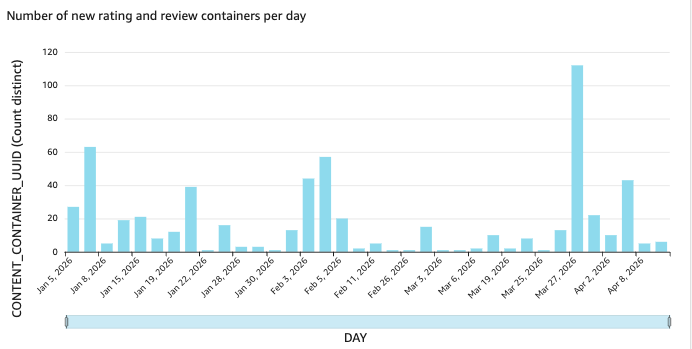
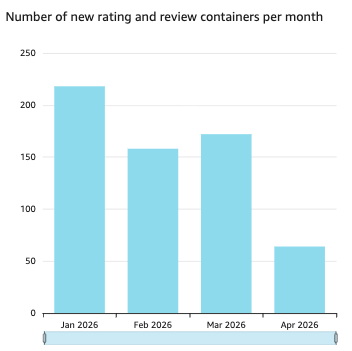
Number of new Ratings and Reviews Containers Created on that day
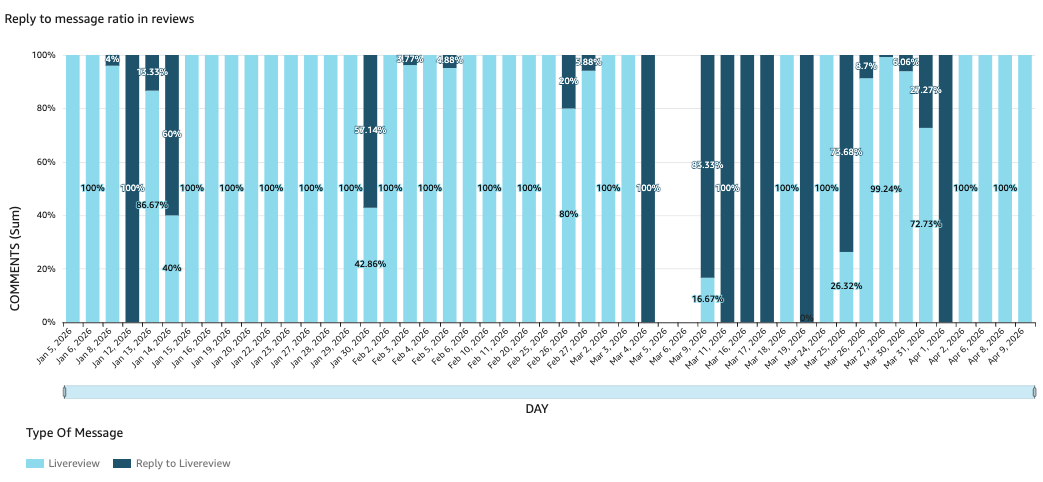
% of Reviews created that are in response to other Reviews
User Interactions
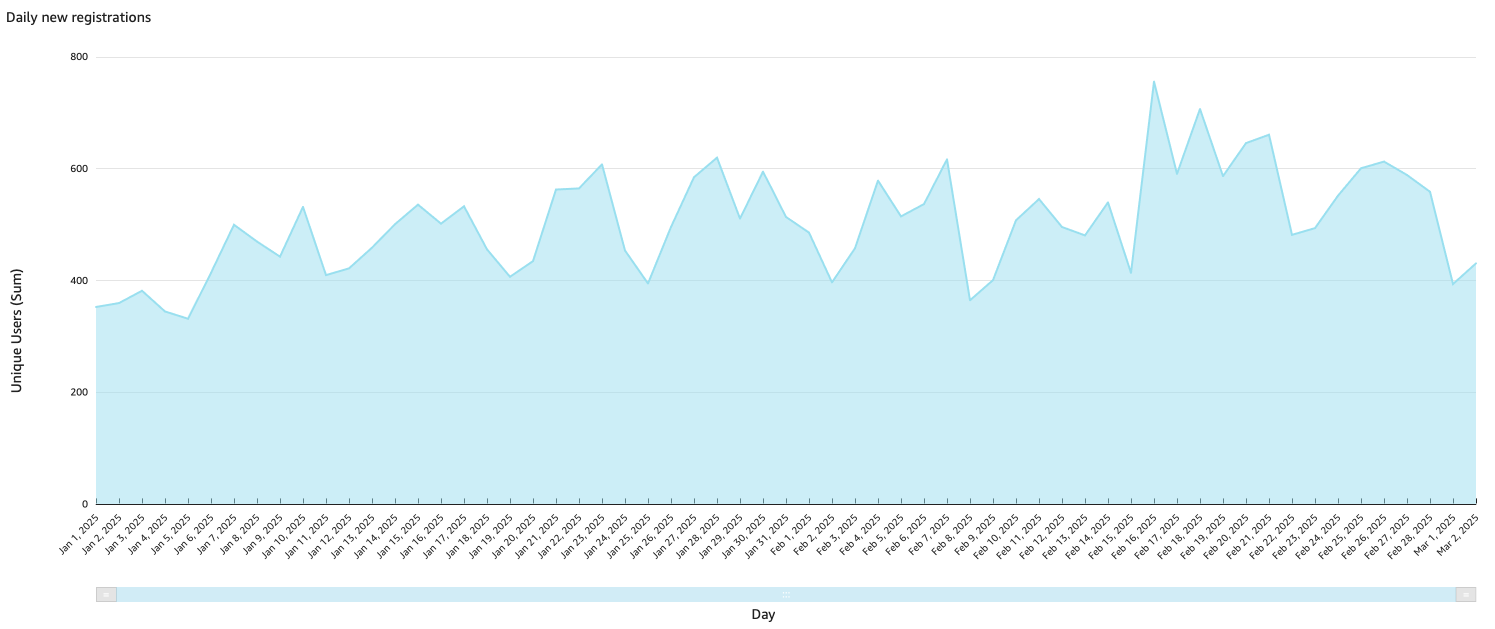
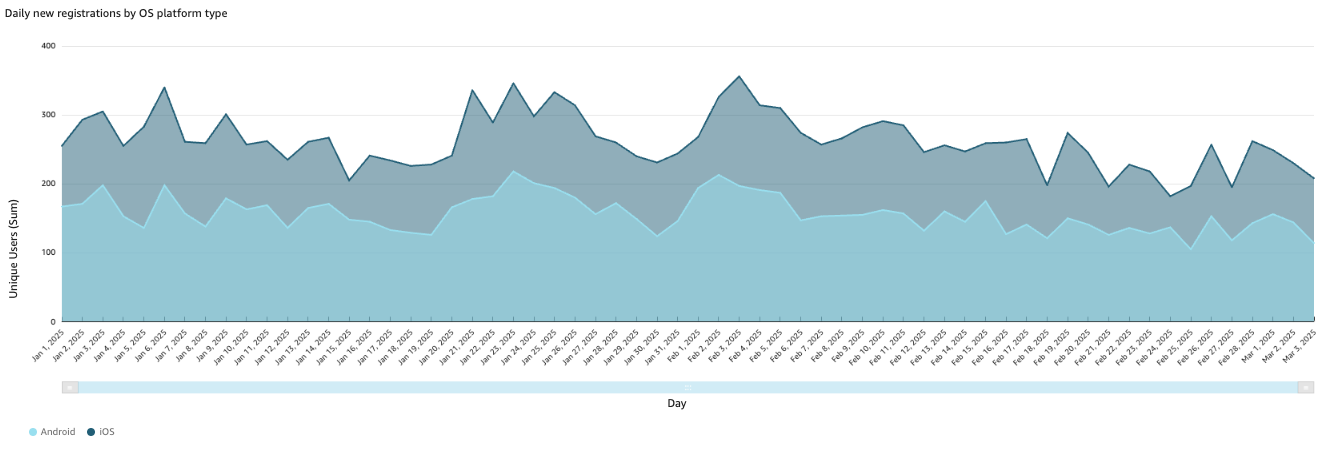
When a user creates an account on a client site the account information us shared/sent to Viafoura via API or front-end code and creates a brand new record in Viafoura's back end system
In some cases not all registrations are passed to Viafoura, depending on your set up registrations may only be passed to Viafoura if a user engages with any of the Viafoura features on-site
Sometimes when clients migrate their auth system and decide to ask users to effectively re-register their account (often to reset a password in the new auth system) we will see an influx of "new" registrations. This can happen during onboarding and depends on how users are transitioned to Viafoura
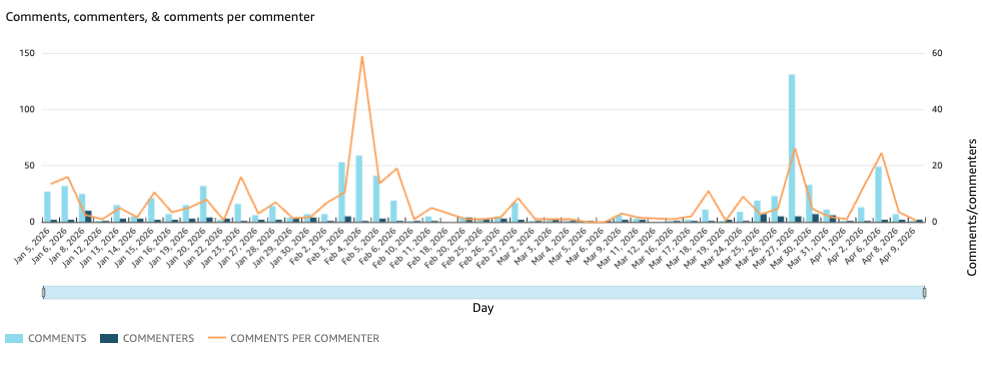
Number of Unique Comments and unique Commenters per day
This is based on date created and not moderation actions.
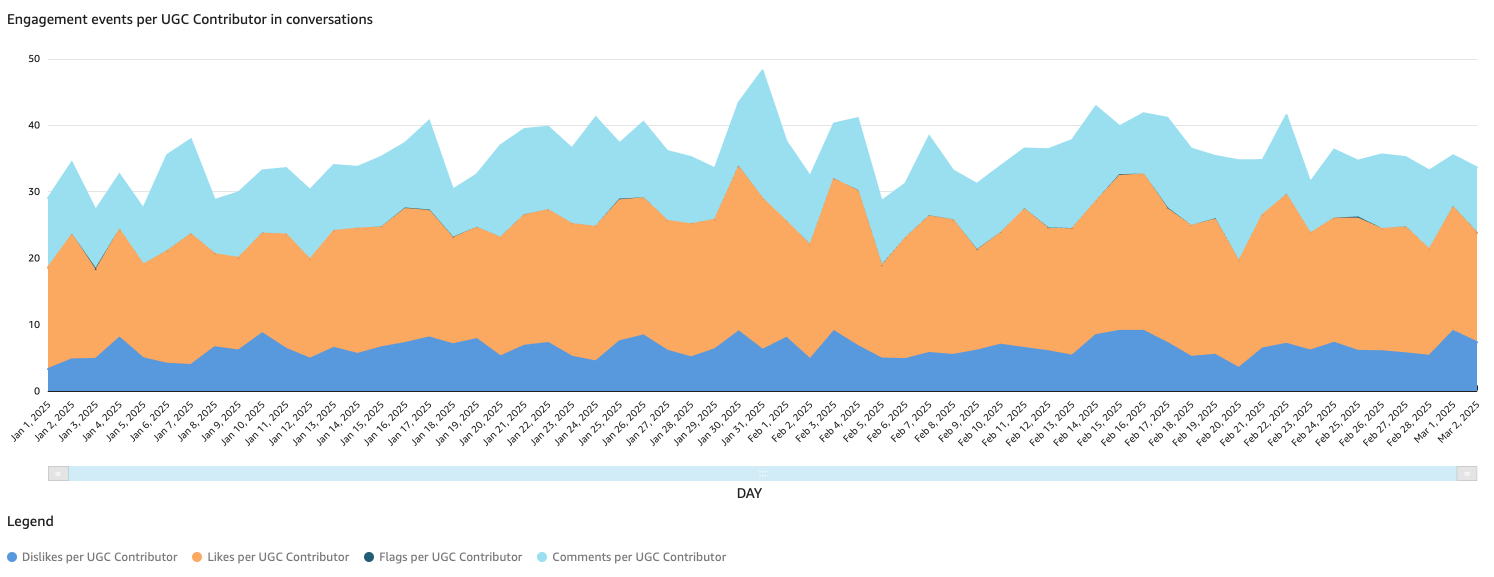
Number of unique engagement events and unique UGC Contributors per day

This chart shows all subscription funnel events](https://files.readme.io/02520c3ca763986e6808634a59304bfd5e2b4fbc7808e77d100daf2ddd323b44-Screenshot_2025-03-18_at_11.05.46_AM.png)
Subscription data shared by clients using Viafoura Events Implementation
This chart shows all subscription funnel events
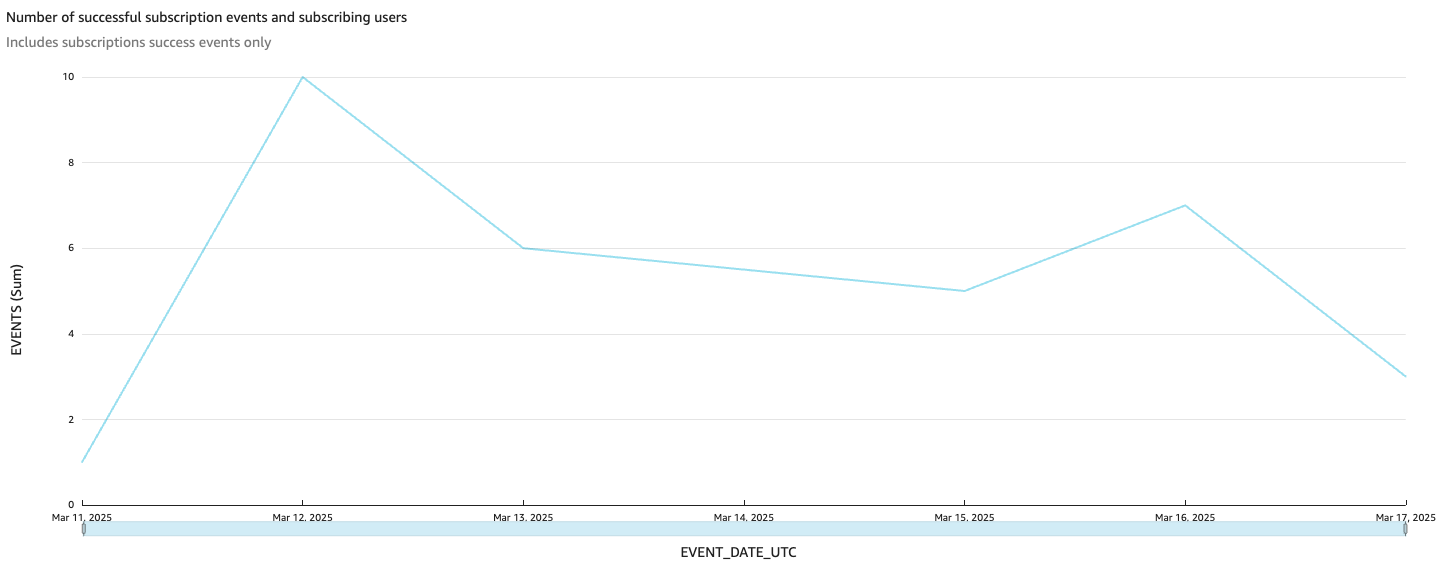
Shows all success events (the last step of the funnel)
](https://files.readme.io/e5f0ebcd60c84c1077394eaab8f973bc6dda00960b07491a1dd7b87899e41a67-Screenshot_2025-03-31_at_12.35.31_PM.png)
The number of times users saw the walls broken down by wall type
More information available HERE
Articles
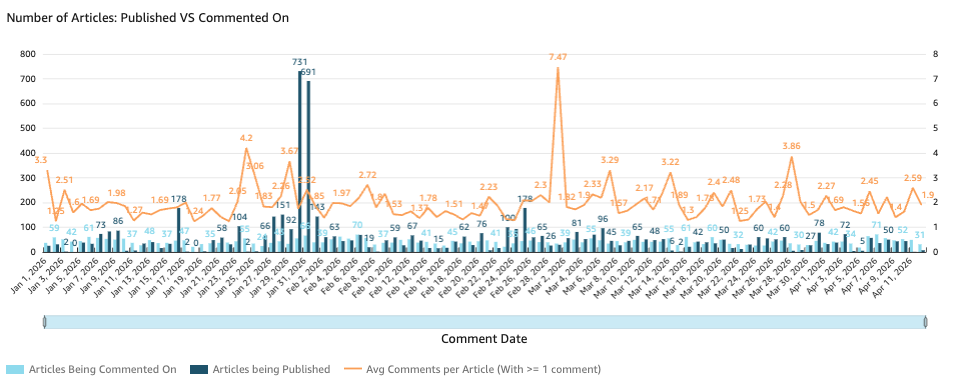
New Articles Published with Comment Section by Day
Articles being commented on per day, an Article can appear for multiple days if it receives a comment on that day
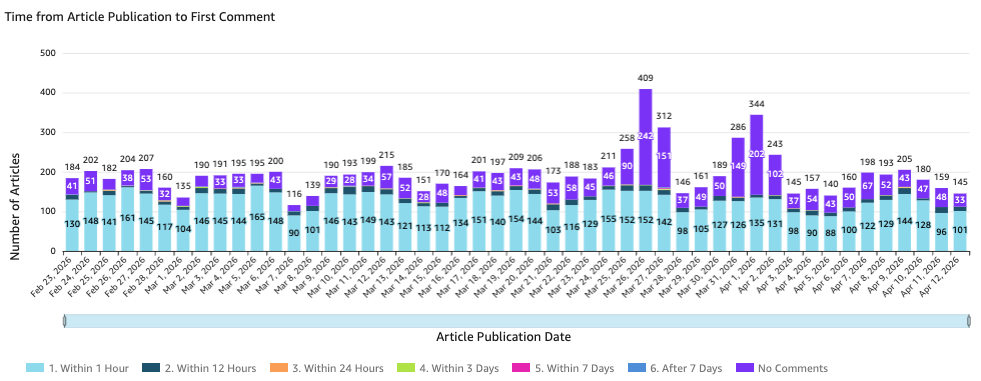
From Comment Container Creation date until the article receives its 1st Comment
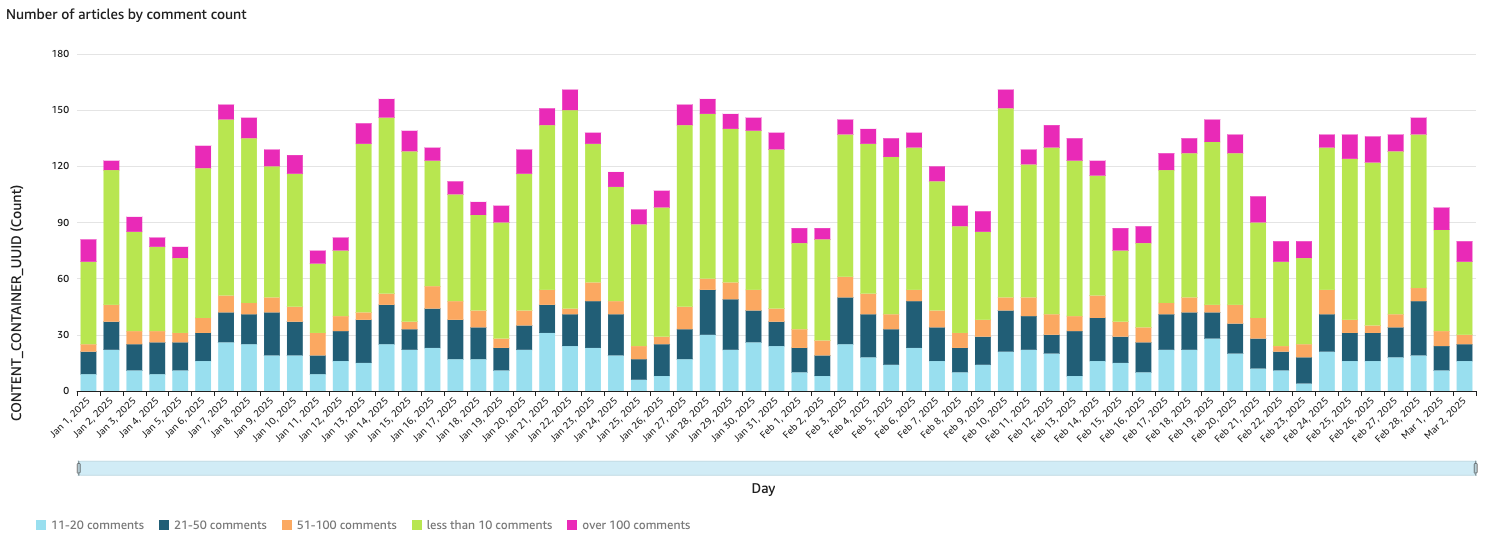
Articles bucketed by Comment count on comment container creation day (article publish day)

Shows top articles for engagement actions by URL (not container)
You can sort by column, by clicking on the column names and selecting sort ascending or descending (ticket submitted to fix this)
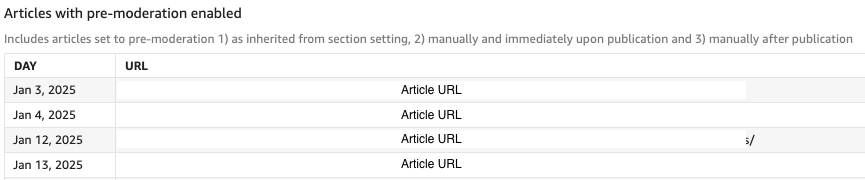
Articles that have been set to pre-moderation
Articles may show up multiple times as we check the status every day
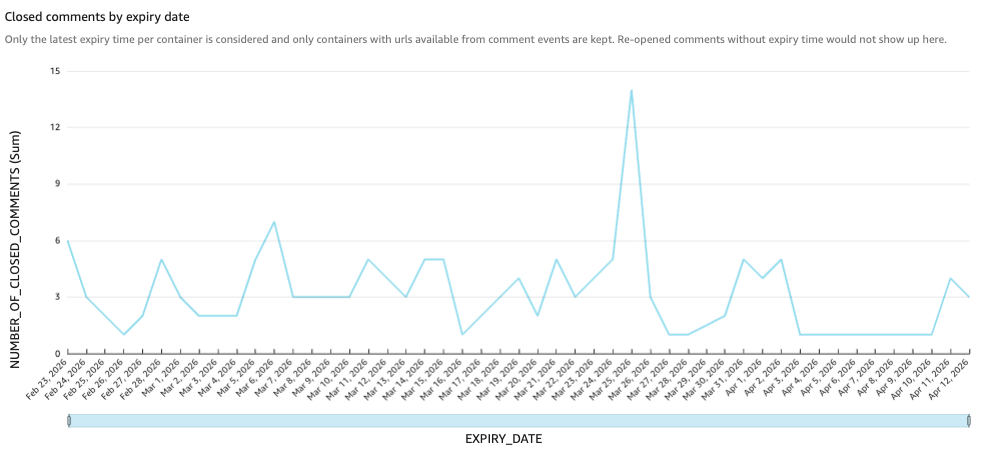
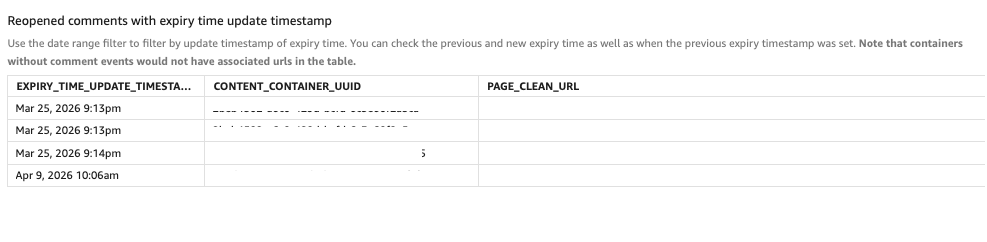
If a comment section was closed, this table can be used to track when it re-opened.
Mainly used for troubleshooting purposes.
Moderation
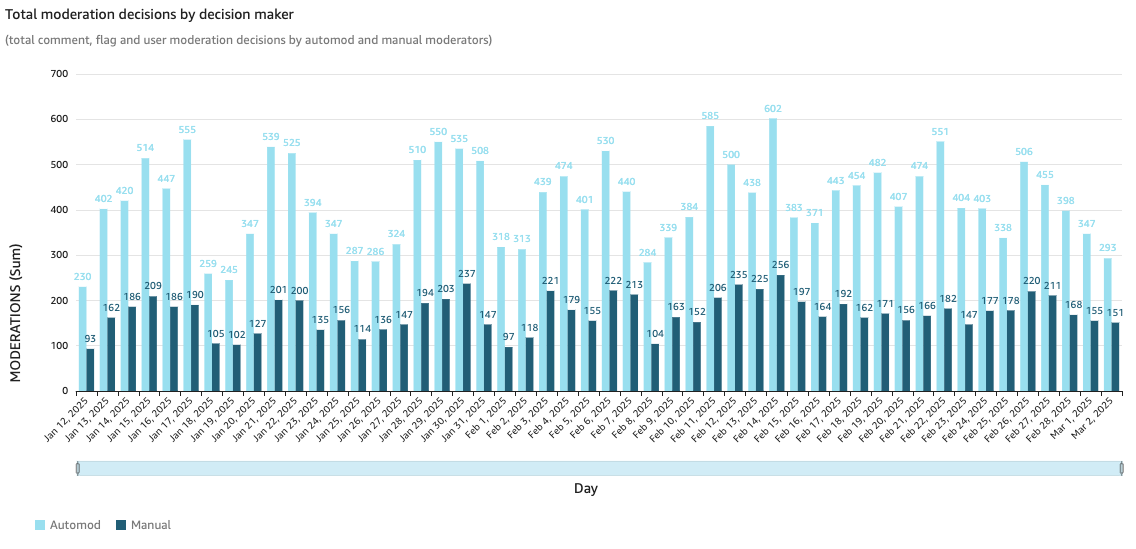
All moderation decisions broken down by auto-mod or manual
Total moderation decisions will be higher than total comments as comments can be moderated multiple times.Examples: If a comment has been edited, it will pass through moderation each time. If a comment has been approved by the auto-mod and then flagged by a user it will then be human moderated.
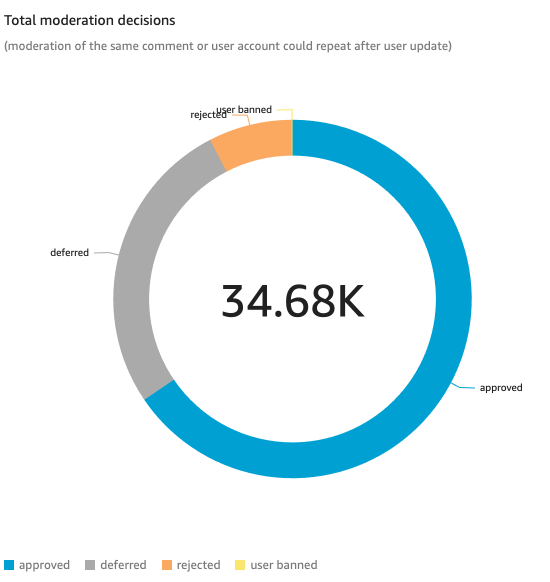
All moderation decisions for time period selected
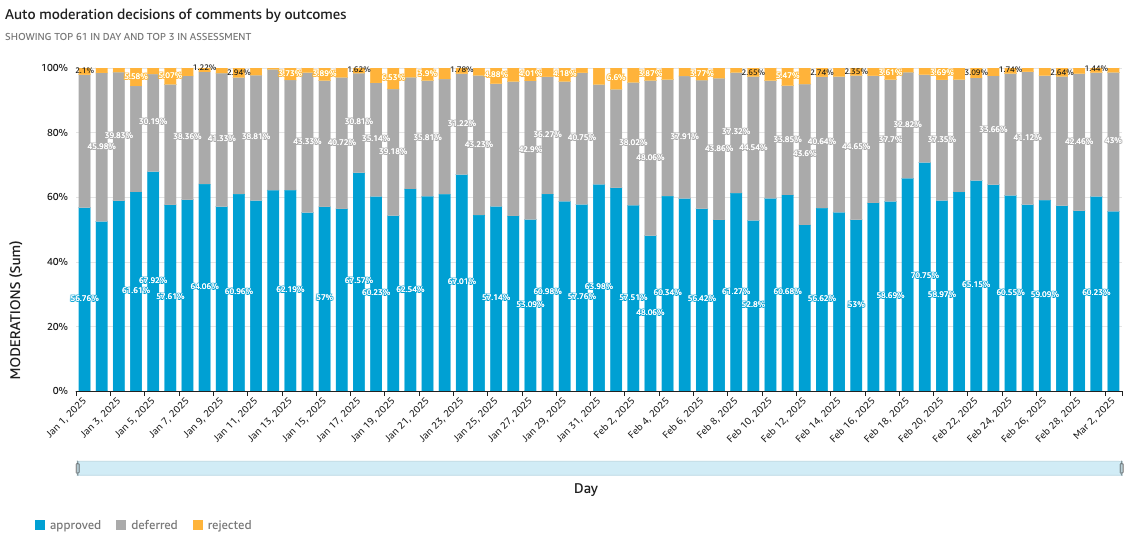
Auto-moderation decisions of comments
Auto-moderation decisionsApproved: The algorithm has approved the comment and it goes live in real-time
Deferred: The auto-mod sends the comment for human review
Rejected: The comment is auto-rejected and does not go live
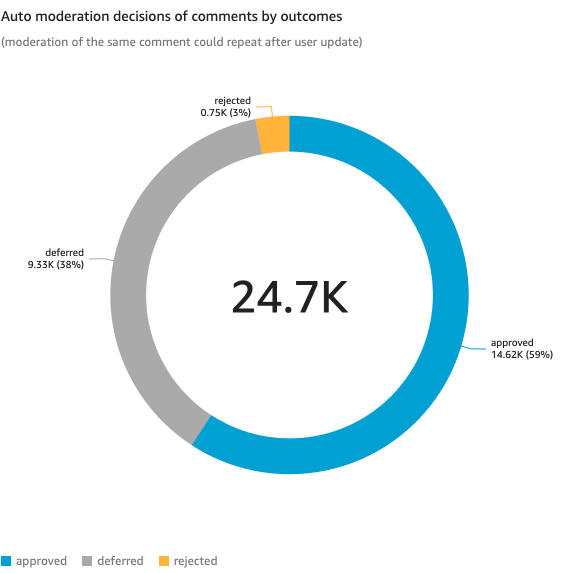
All auto-moderation decisions for time period selected
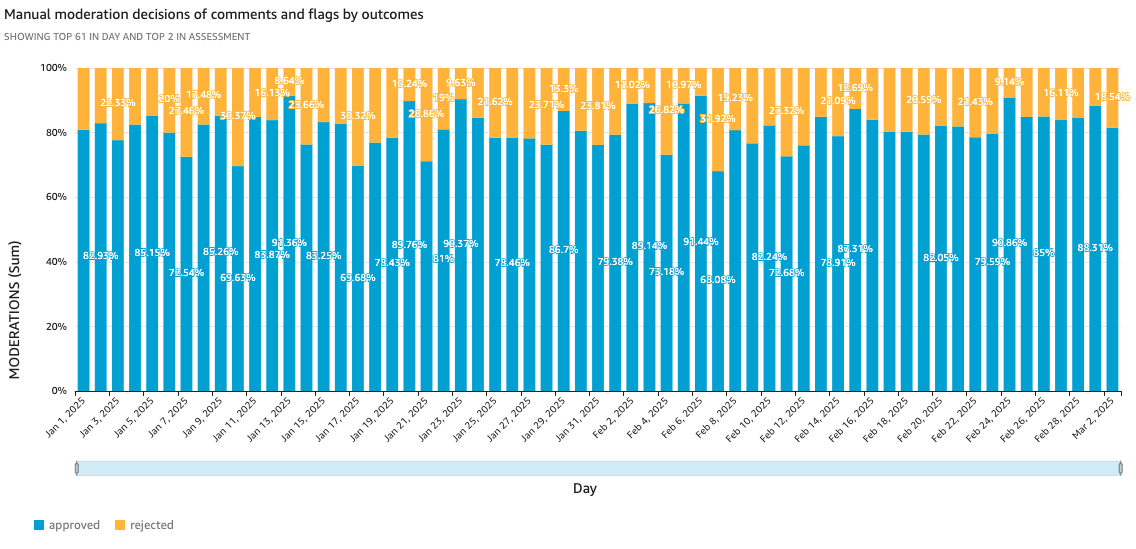
Manual (Human-mod) decisions
This will include all deferred, flagged and NUQ comments
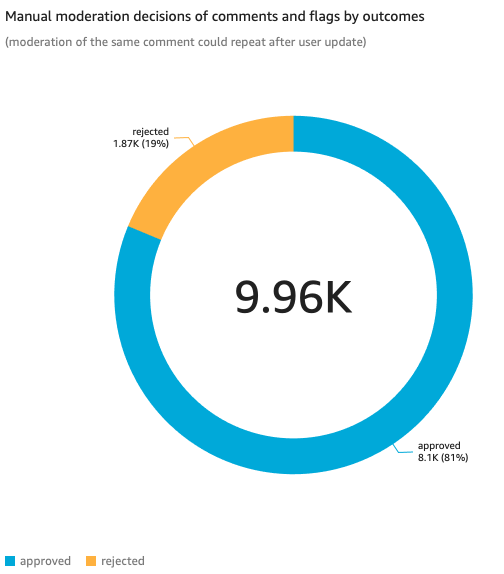
Manual moderation decisions for time period selected
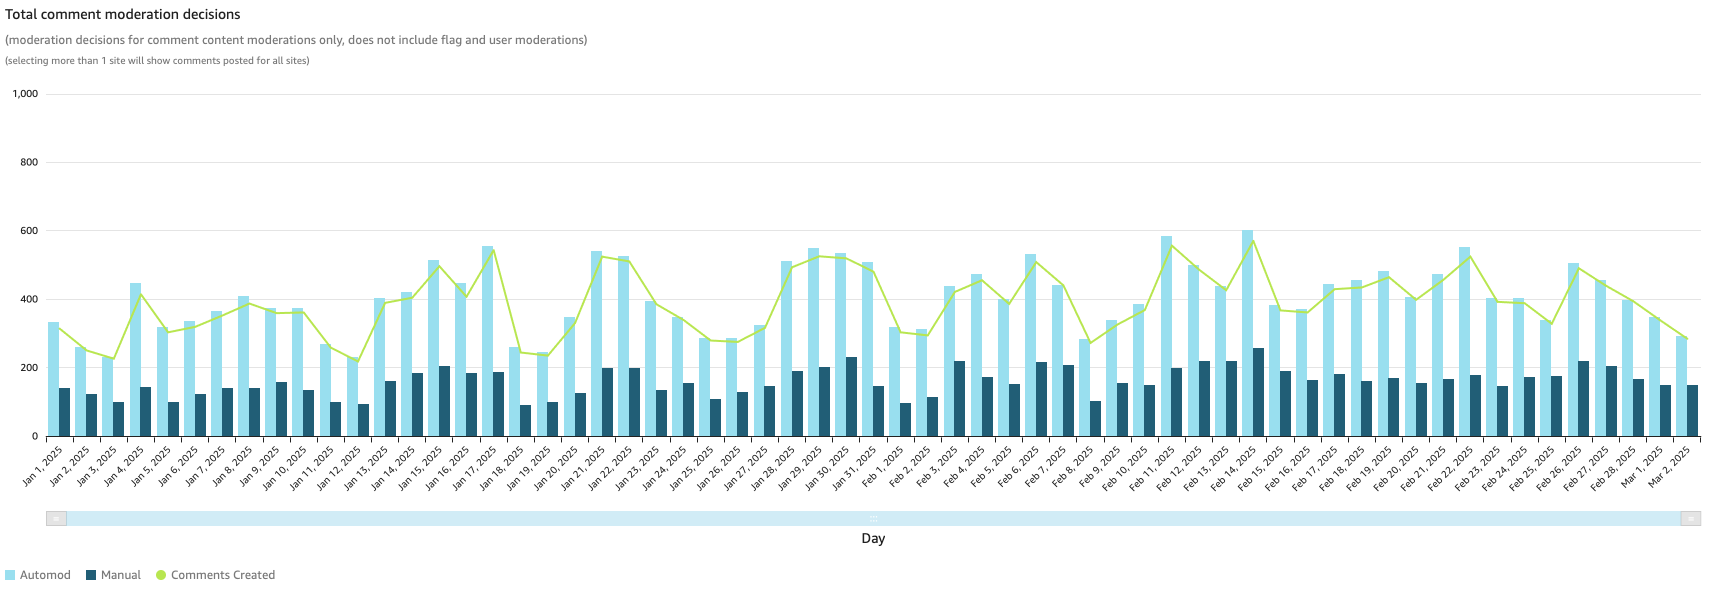
Comment moderation decisions
A comment often has more than 1 moderation action associated with it
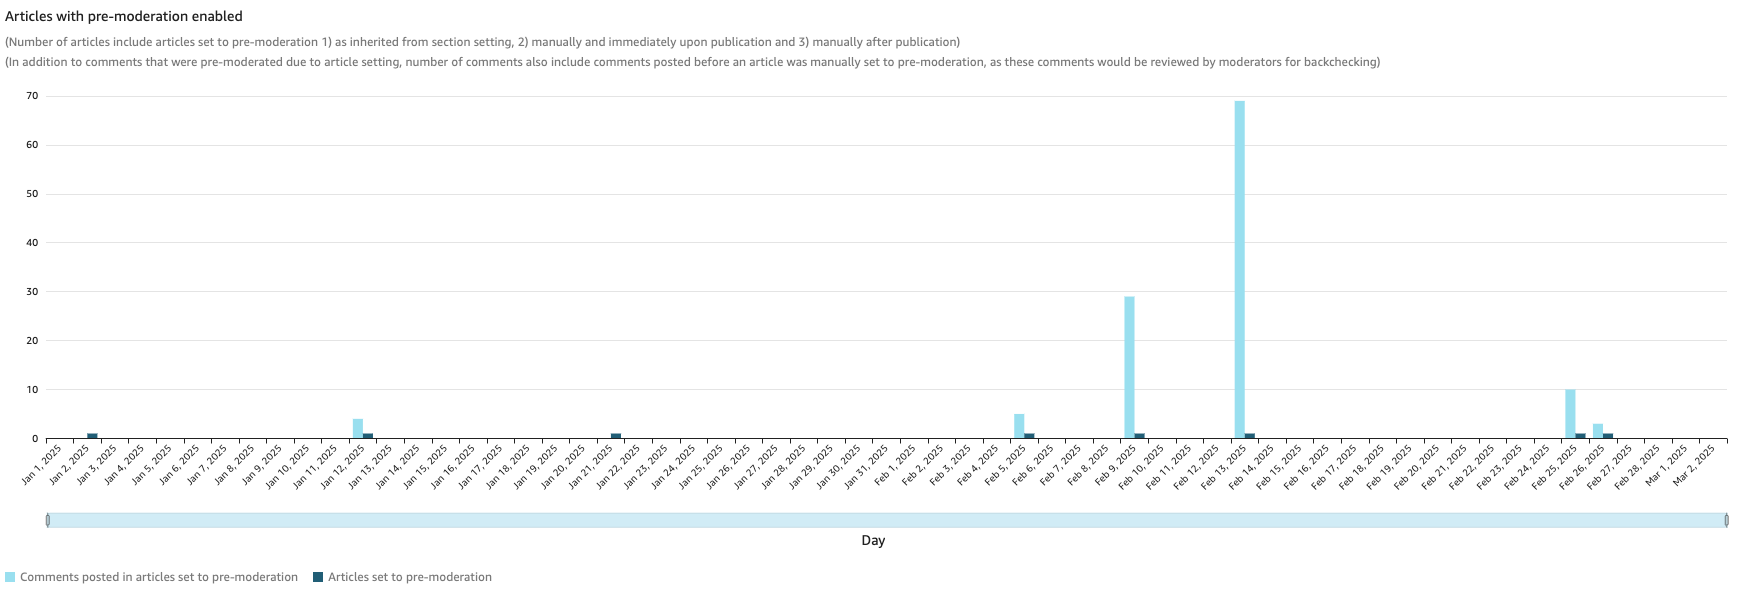
The number of articles with pre-moderation enabled
Based on the day the container is created (article published)
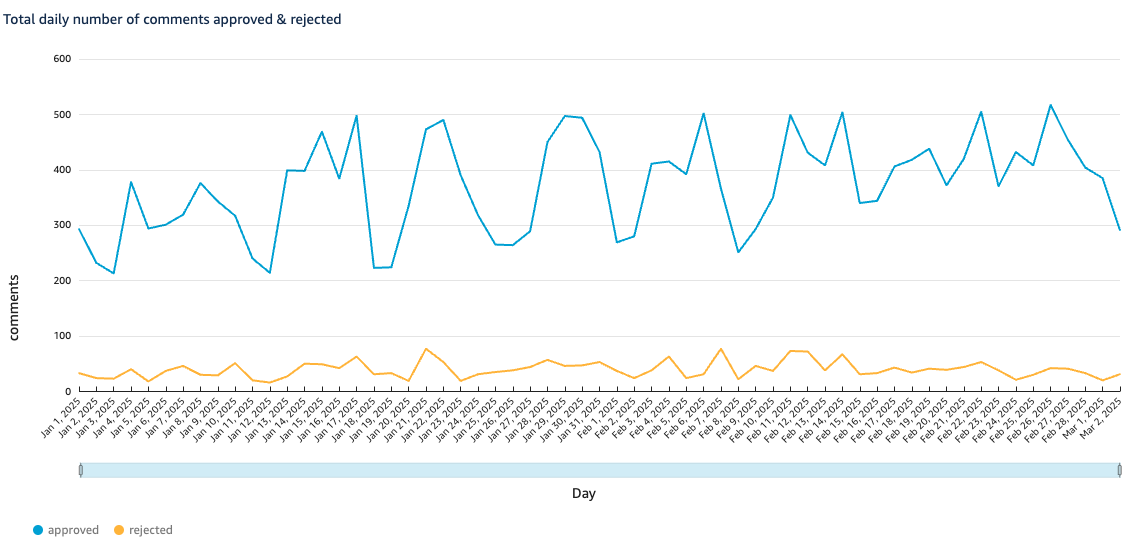
Unique comments outcomes
Despite how many mod actions each comment only counts as 1
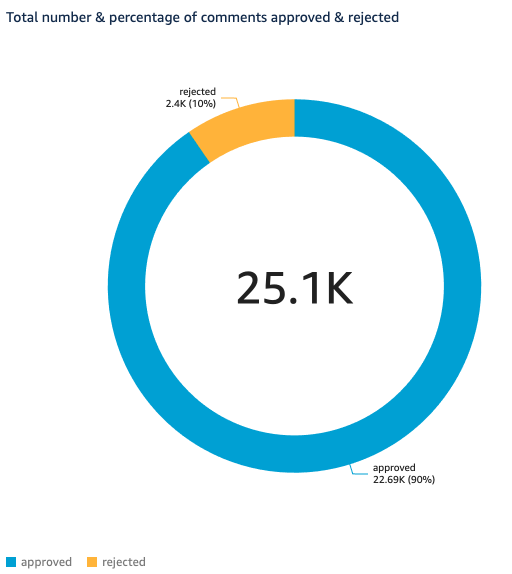
Comments approved or rejected by time period selected
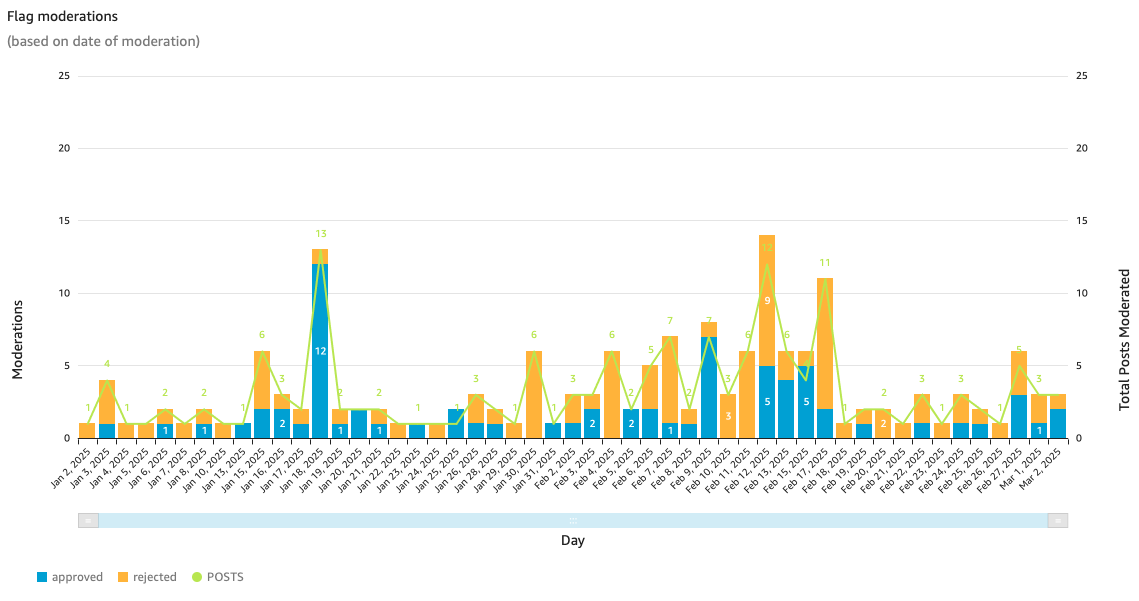
Reported comments outcomes
Data is based on the date of moderation and not the reported date
Each reported comment should only be reviewed once, so even if a comment is flagged 10 times, this will count 1 moderation action
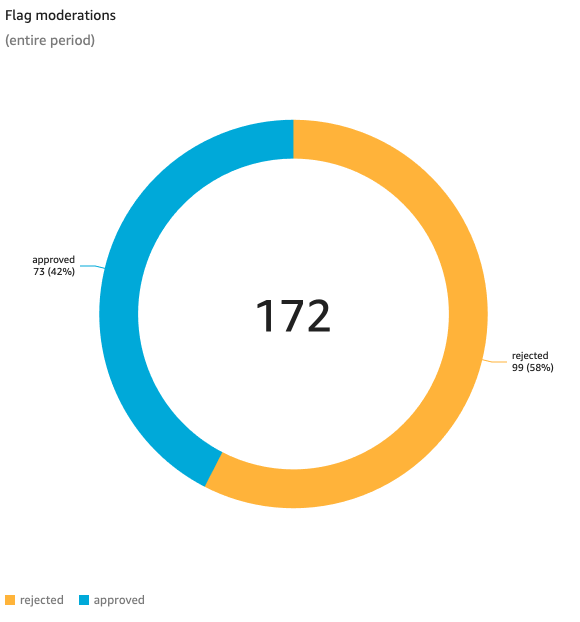
Flagged moderations for the selected period
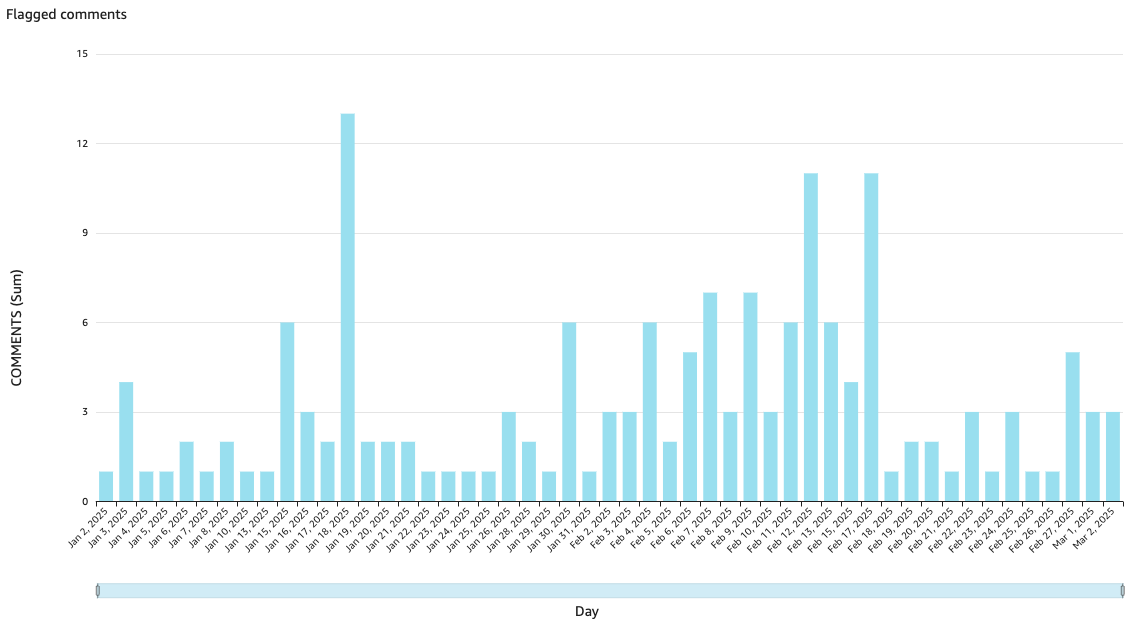
Unique comments flagged per day
If a comment is flagged on Wednesday and Friday it will show up twice
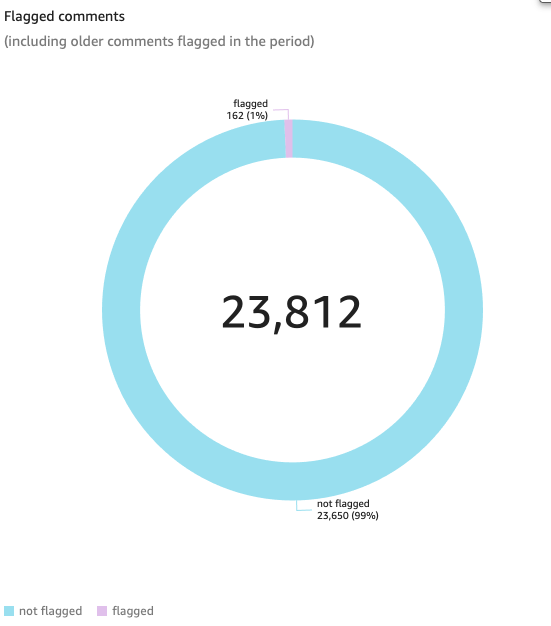
Total Comments Flagged and % of Total Comments for selected period
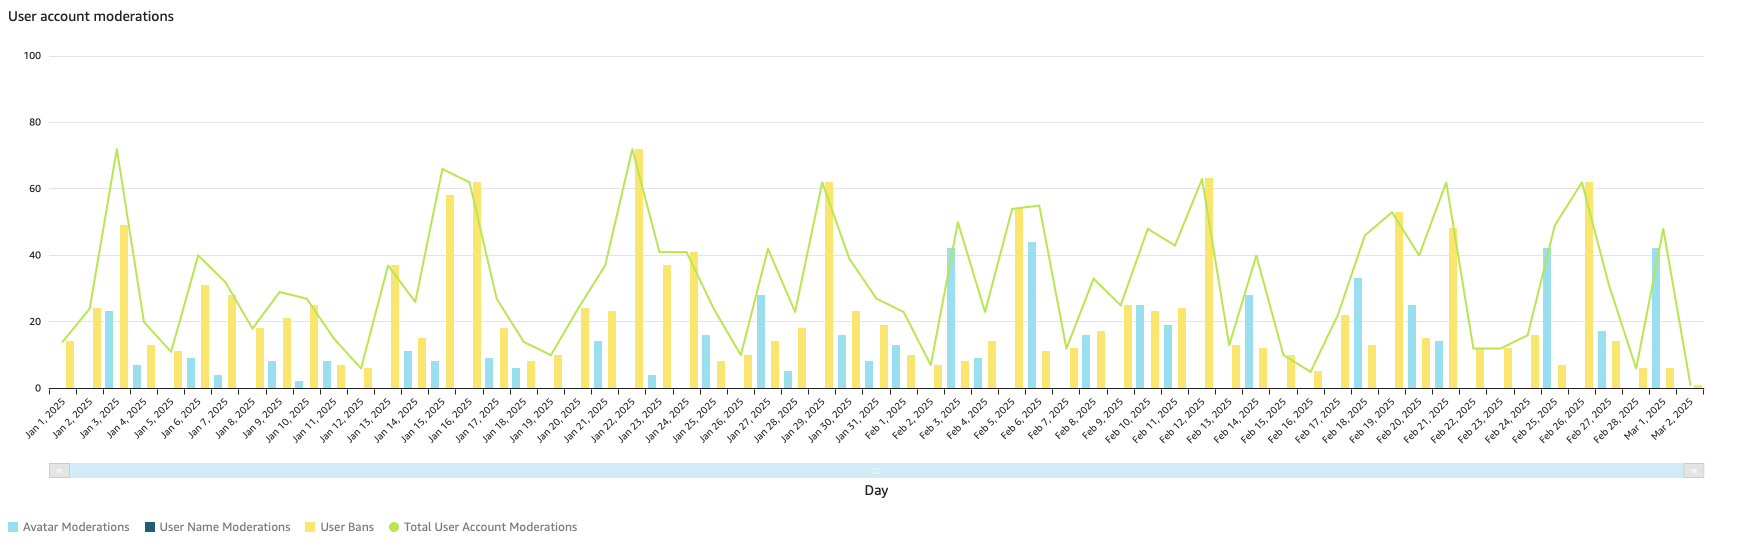
User account moderations covers actions taken on a user and not their comments
Avatar moderations, Username moderations & Userbans
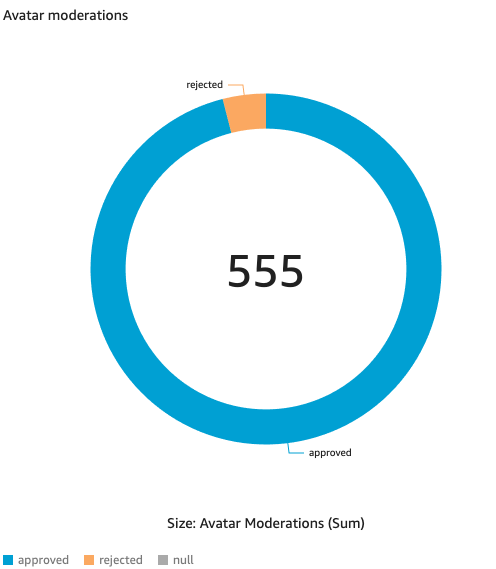
Avatar moderation outcomes
Please note this feature is not available to all clients
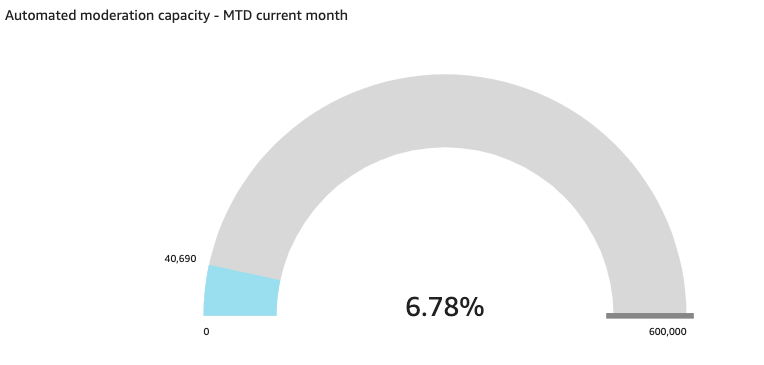
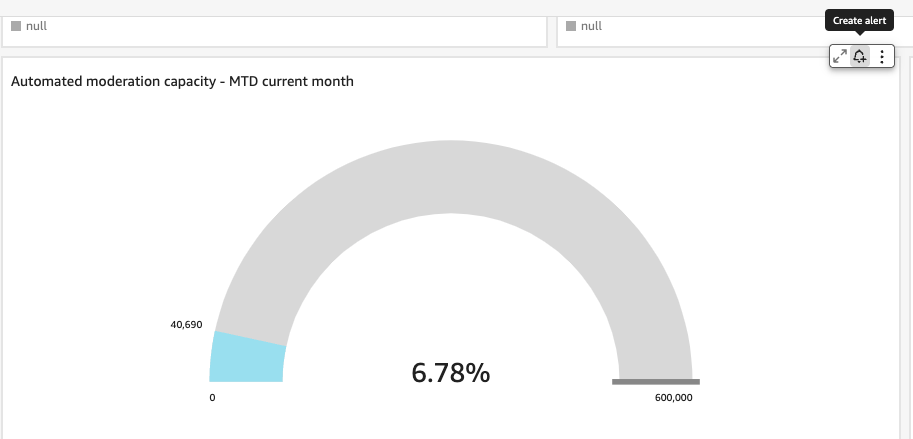
Auto-moderation capacity MTD based on monthly contract volumes
Create an alert to ensure you're aware if trending over capacity


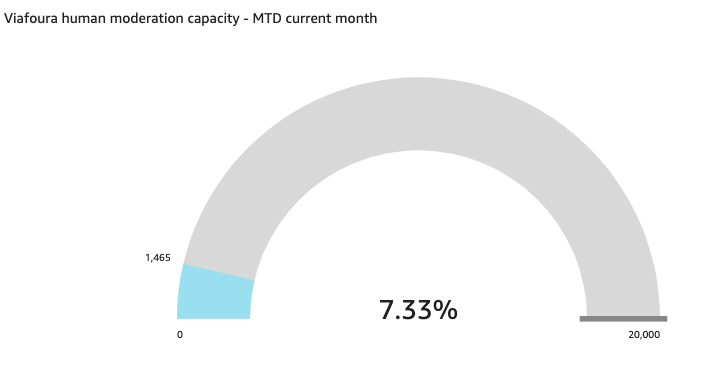
Human moderation capacity MTD based on monthly contract volumes
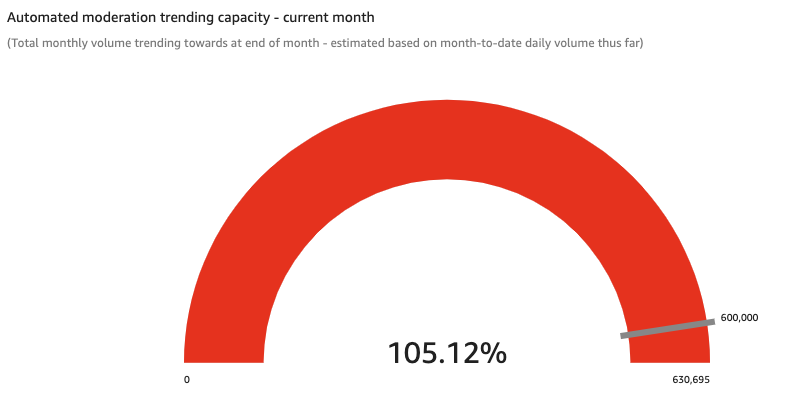
Trending auto-moderation capacity estimate based on daily volumes MTD
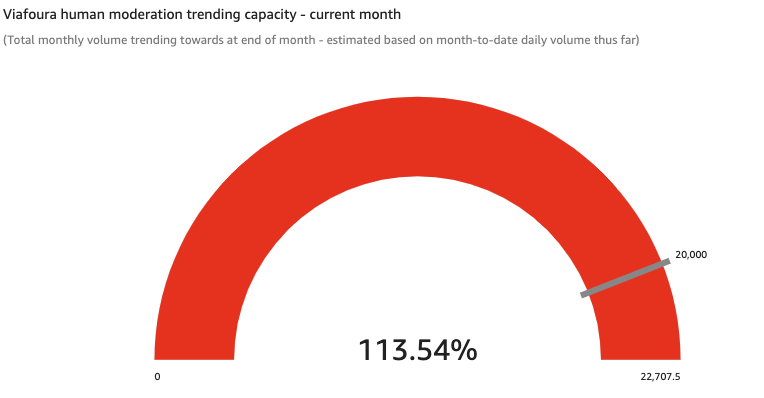
Trending human-moderation capacity estimate based on daily volumes MTD
Users
This tab allows you to select the amount of Top Users you would like to show from 1-200
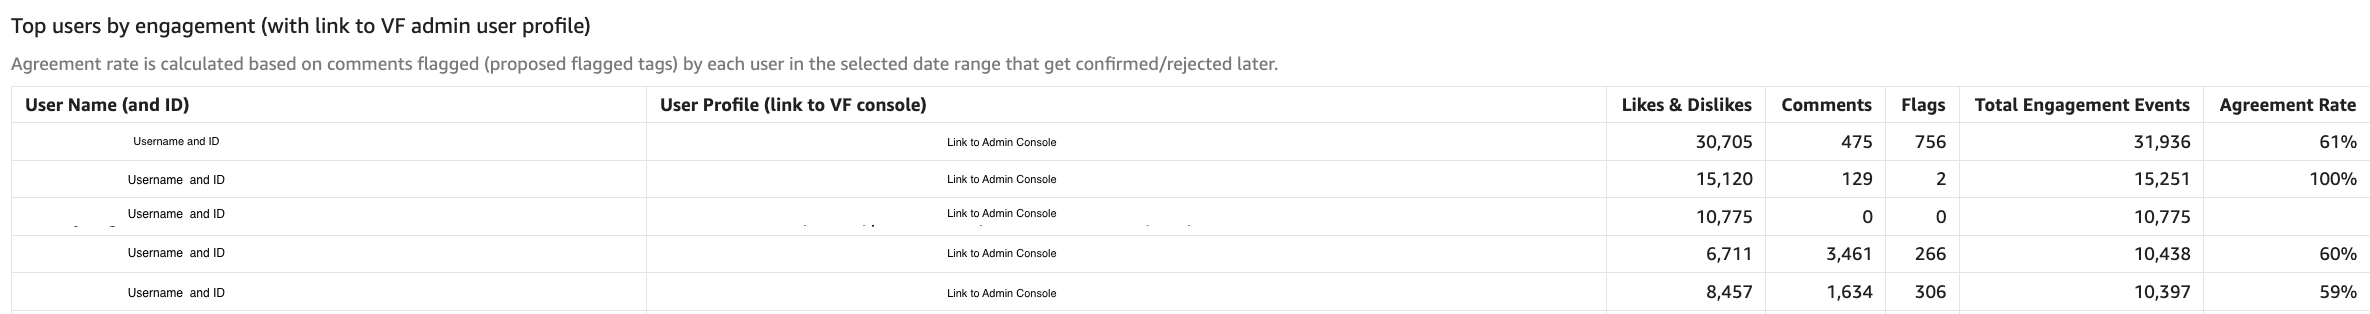
Sorted alphabetically by Username
You can change the sort order by clicking on the column headings
Agreement rate shows the % of comments the user has flagged that we have since removed, therefore agreeing with the user who flagged the comment. A low agreement rate is a good indicator of a serial flagger.
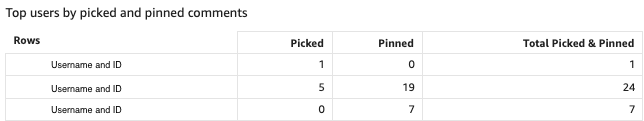
Users in this graph are moderators who are pinning and picking comments

Users posting the 1st comments on articles
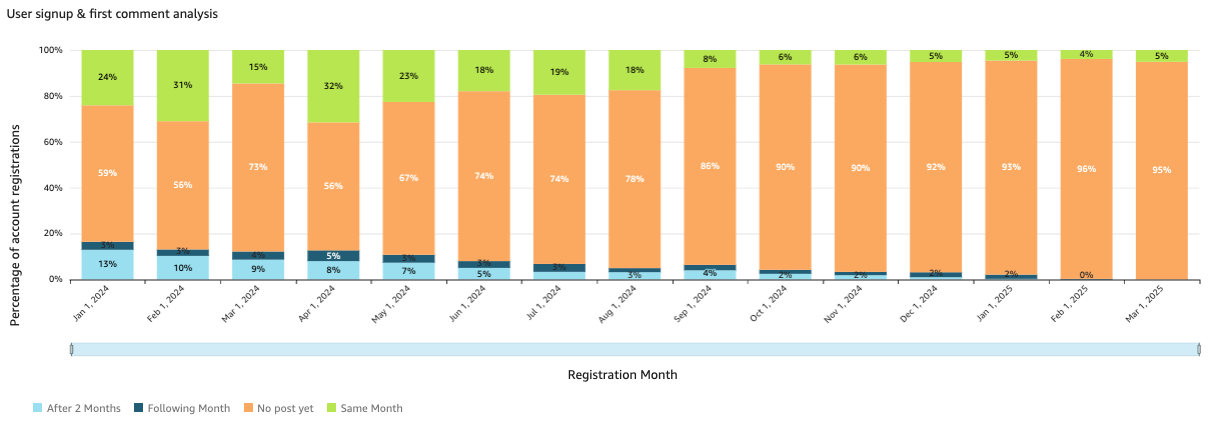
The % of users who register and post their first comment within the period
Attention
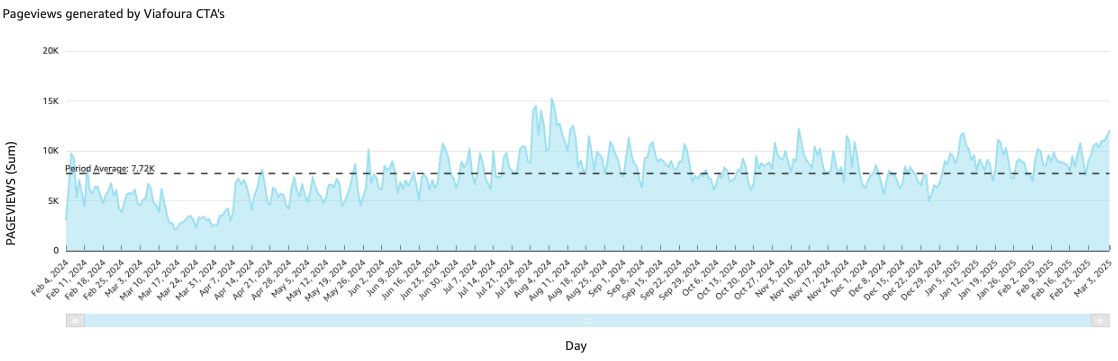
Total Direct Page views generated by users clicking on Viafoura CTA's
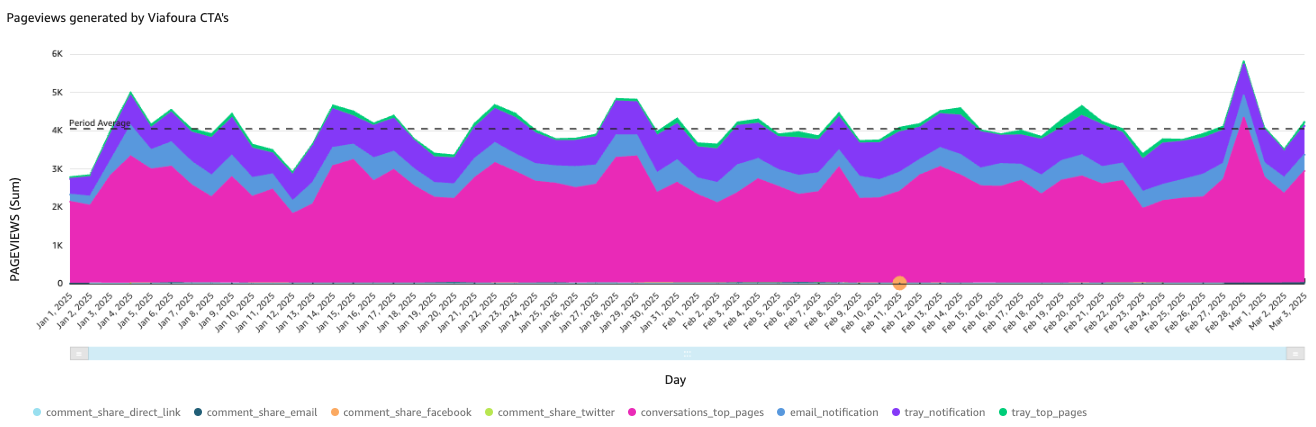
Pageviews generated by Viafoura broken down by source
| Source | Description |
|---|---|
| Conversations Top Pages | Active conversations below the comment section |
| Tray Notifications | PV's generated by users clicking on tray notifications e.g. replies, likes and dislikes |
| Tray Top Pages | Active conversations in the tray |
| Comment Share | Users sharing individual comments |
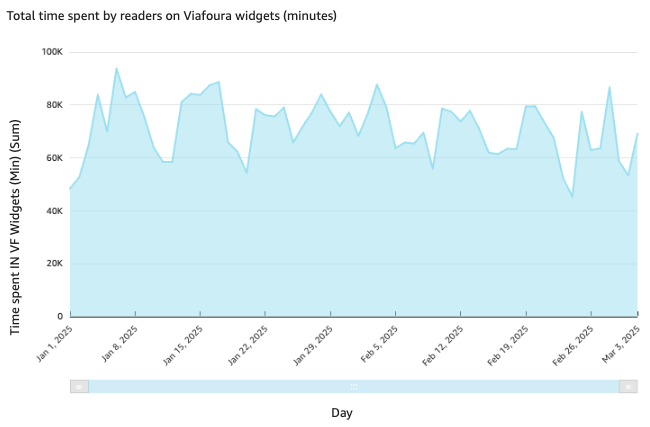
Total time spent in Viafoura this includes Conversations, Blogs, Chats and Ratings & Reviews
This is cookie UID based tracking
At least 50% of the Viafoura element must be in the viewport and the tab or browser must not be in the background
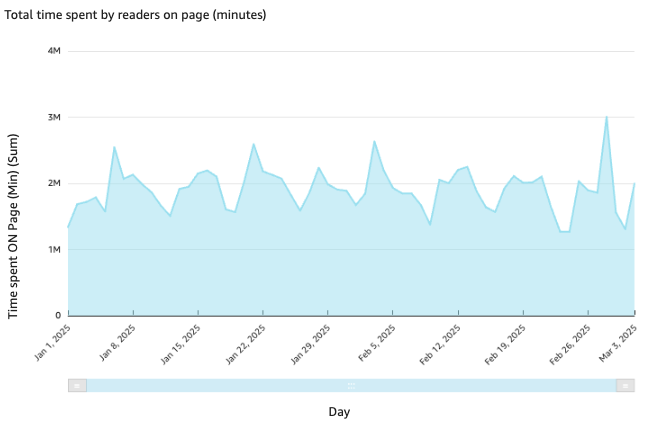
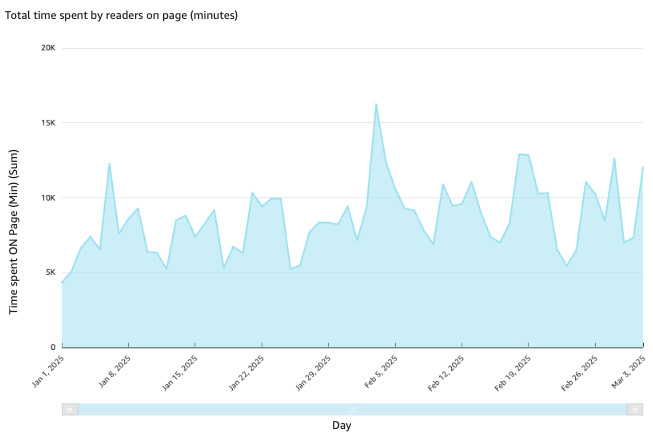
Time spent by users on pages that have the Viafoura js enabled
Cookie UID based tracking
The browser/tab must not be in the background
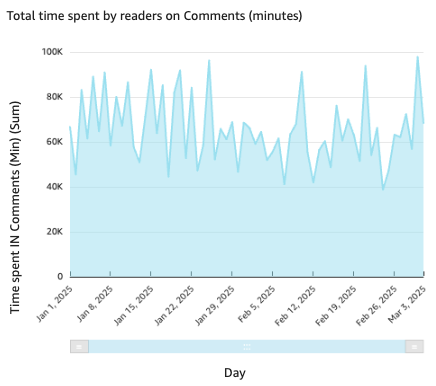
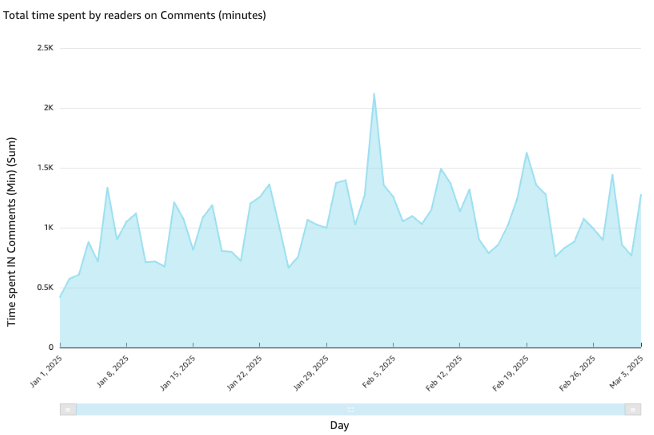
Time spent in the Comment Section
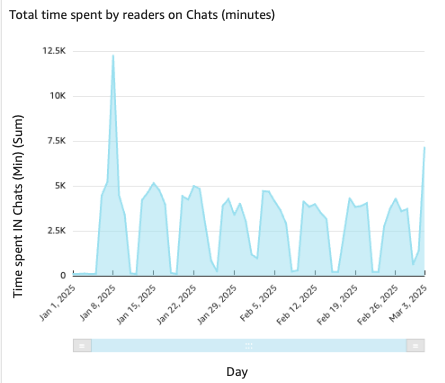
Time spent in Live Chats
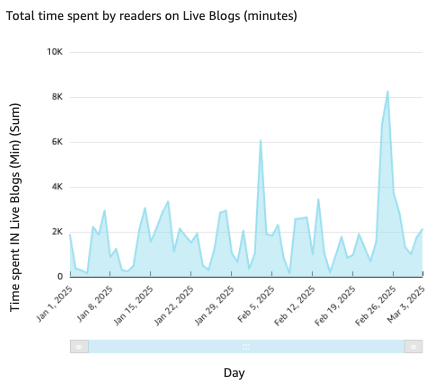
Time spent in Liveblogs
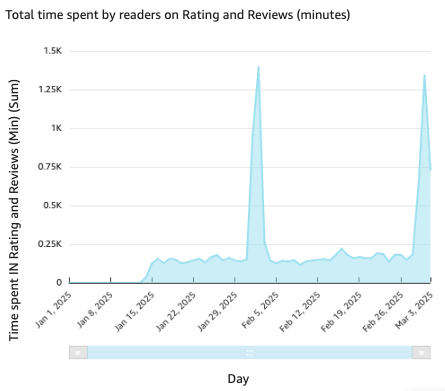
Time spent in Ratings and Reviews
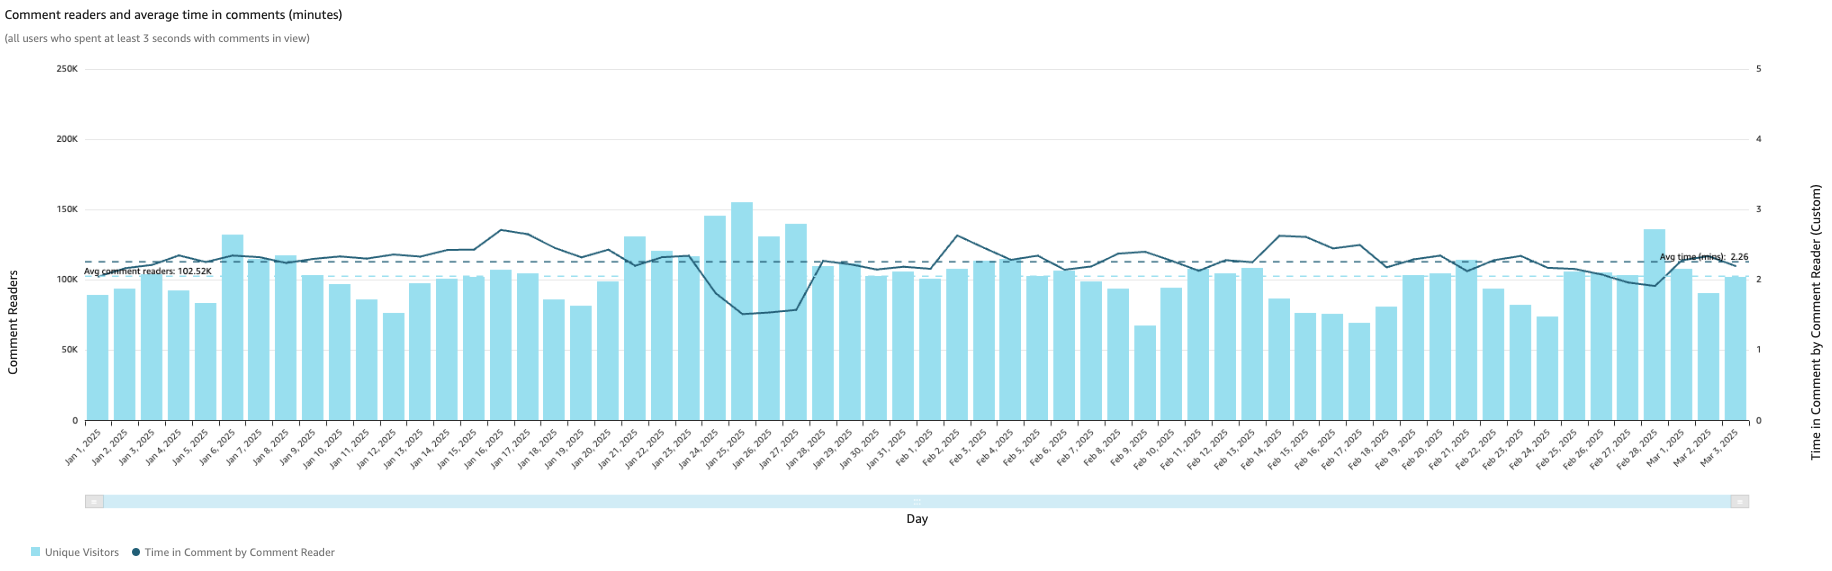
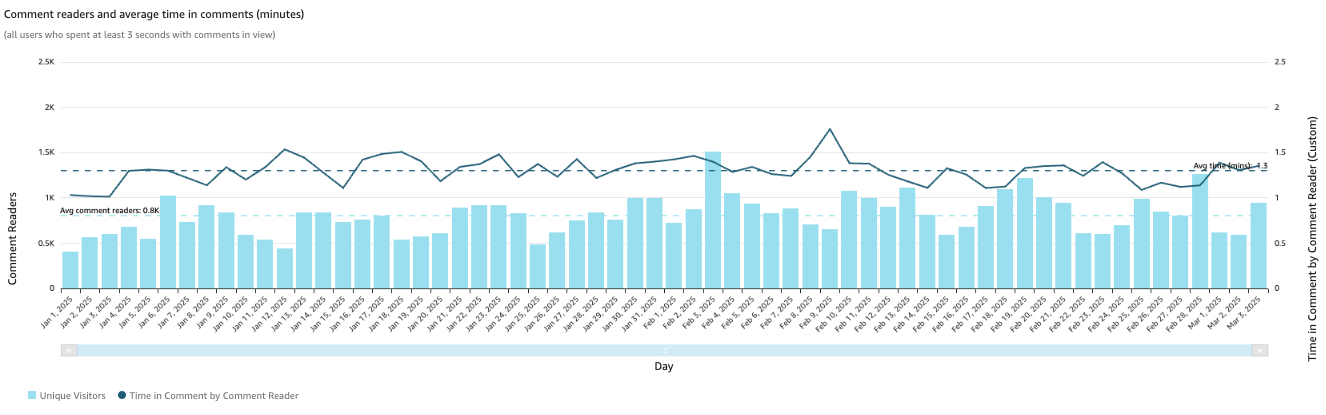
Comment readers with >3 seconds with the comment section in viewport per day
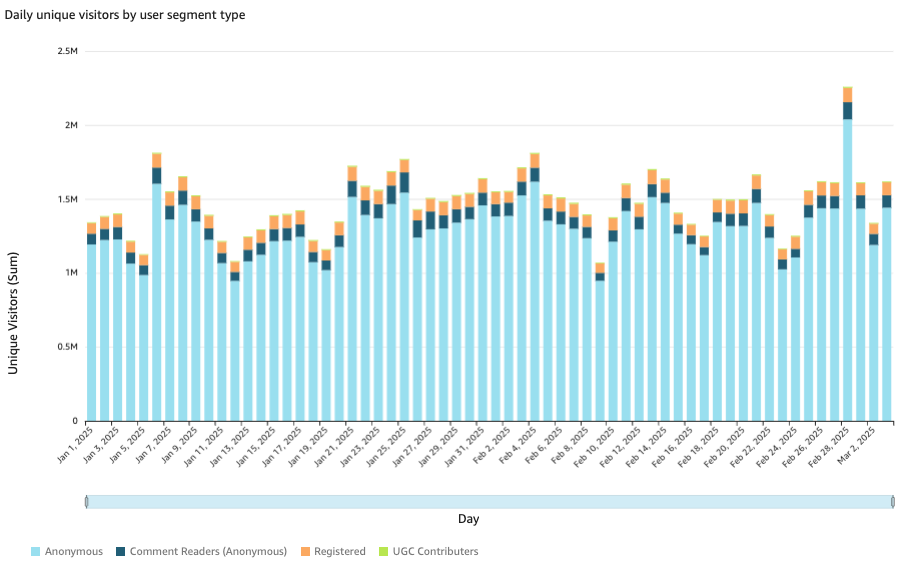
Daily Unique Visitors broken down by Segment Type
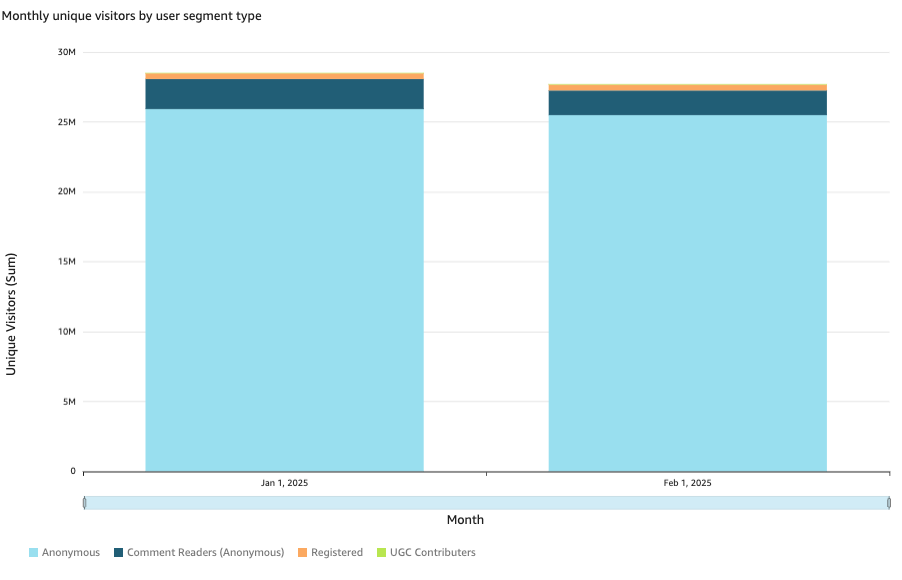
Monthly UVs by segment type
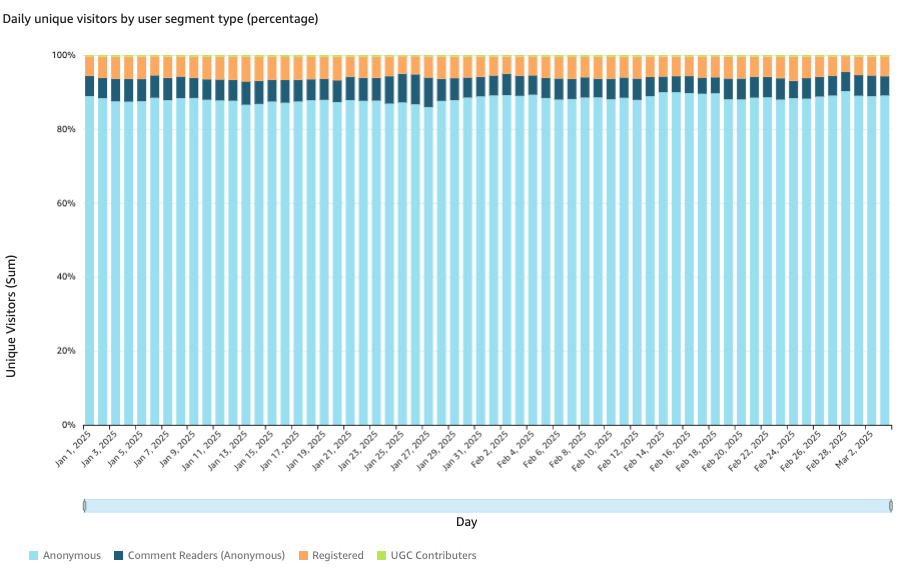
Daily UVs by user segment type (%)
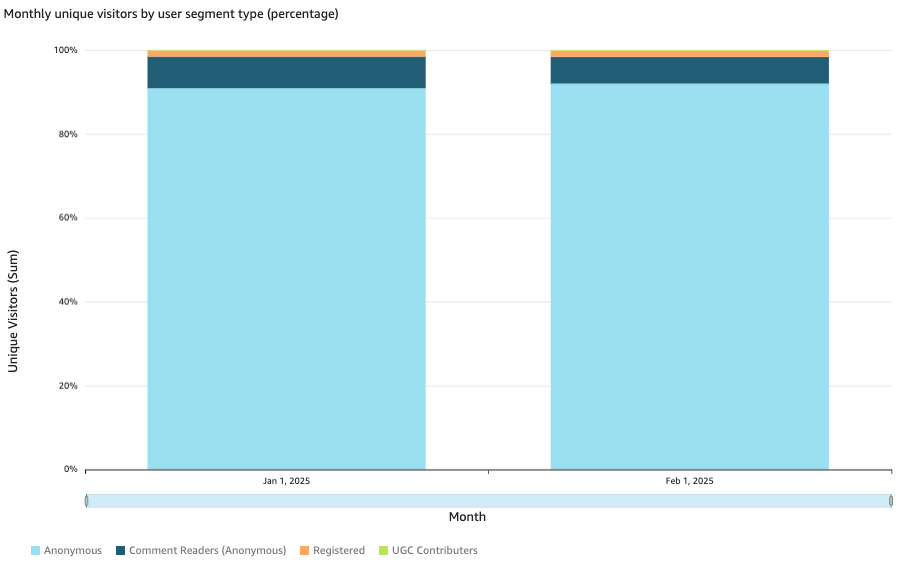
Monthly UVs by segment type (%)
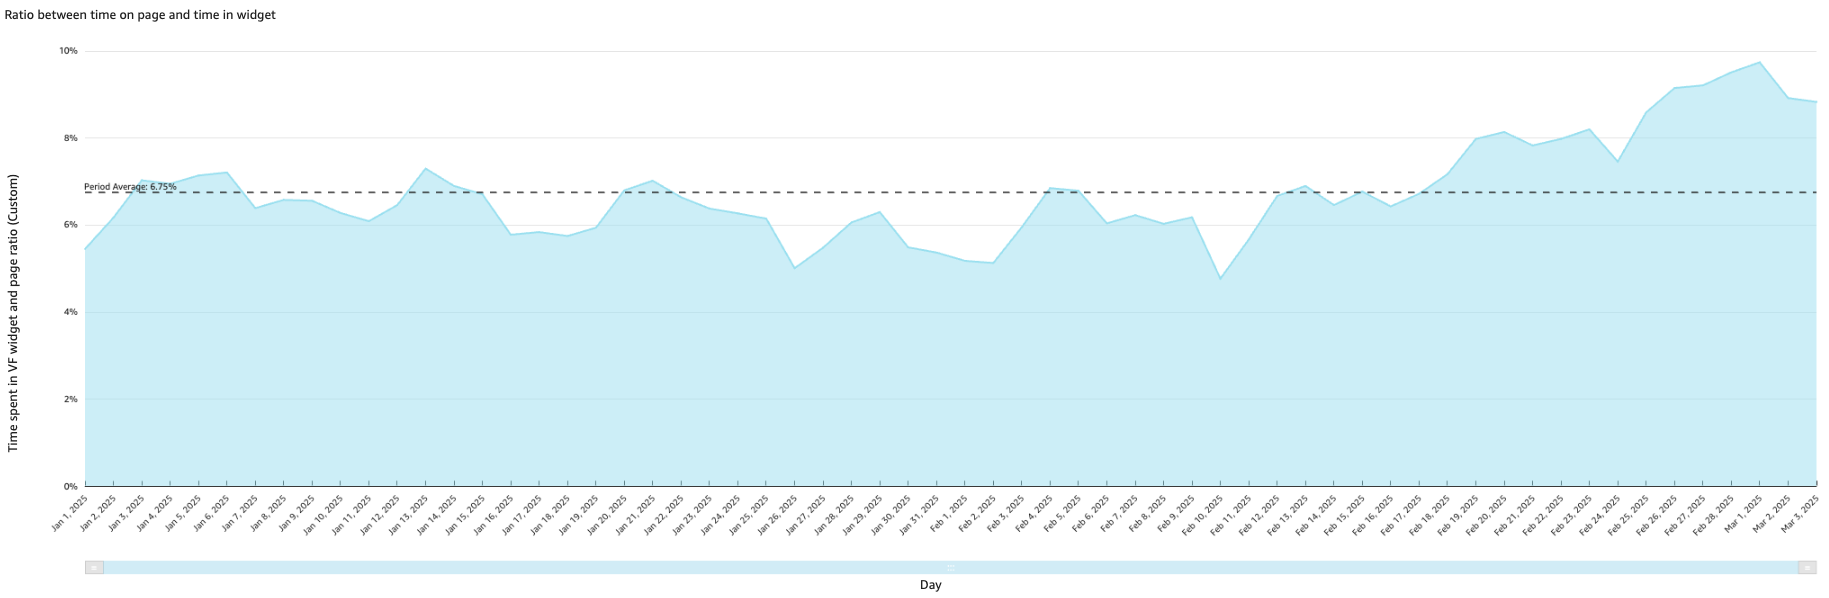
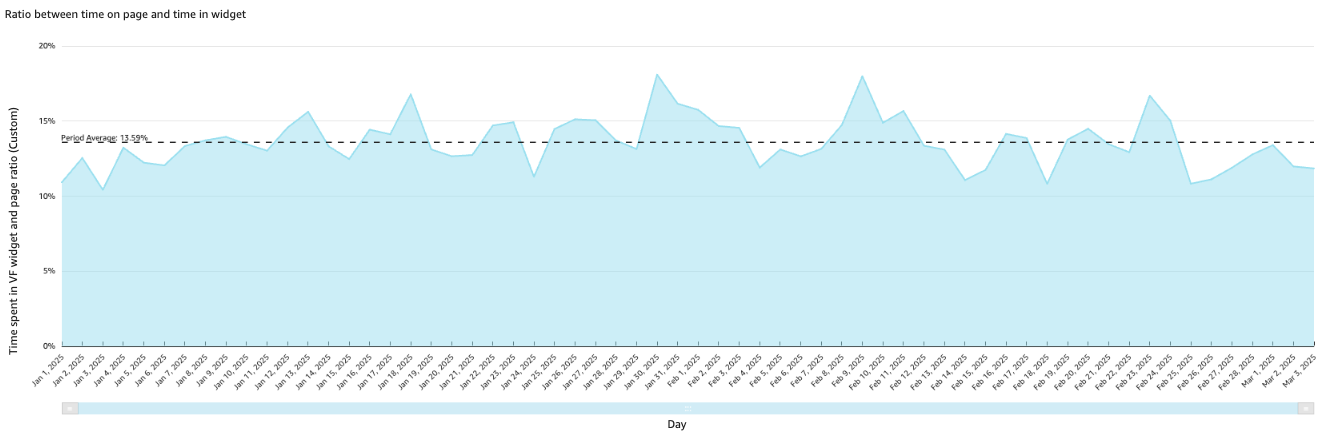
The ratio of Time on Page vs Time in Viafoura Widgets
Bell Performance
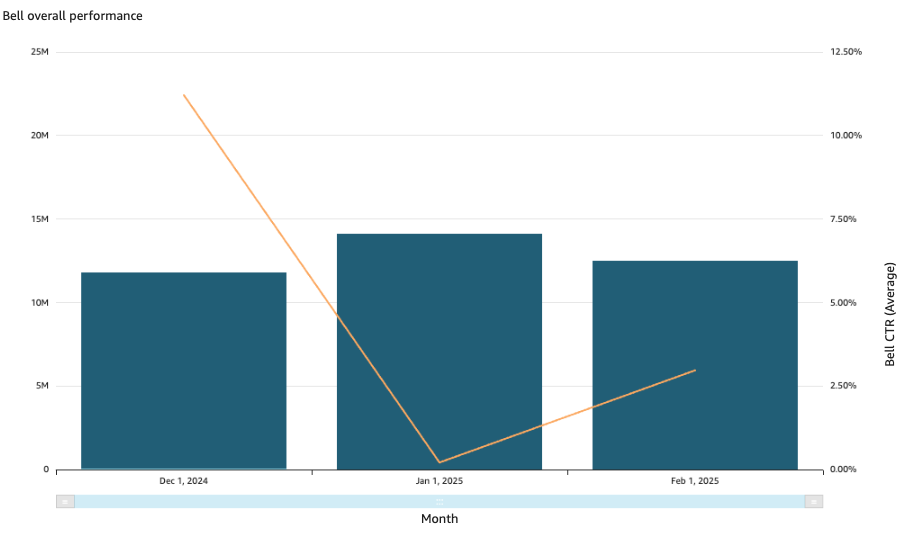
Monthly bell CTR based on loads vs clicks for all users
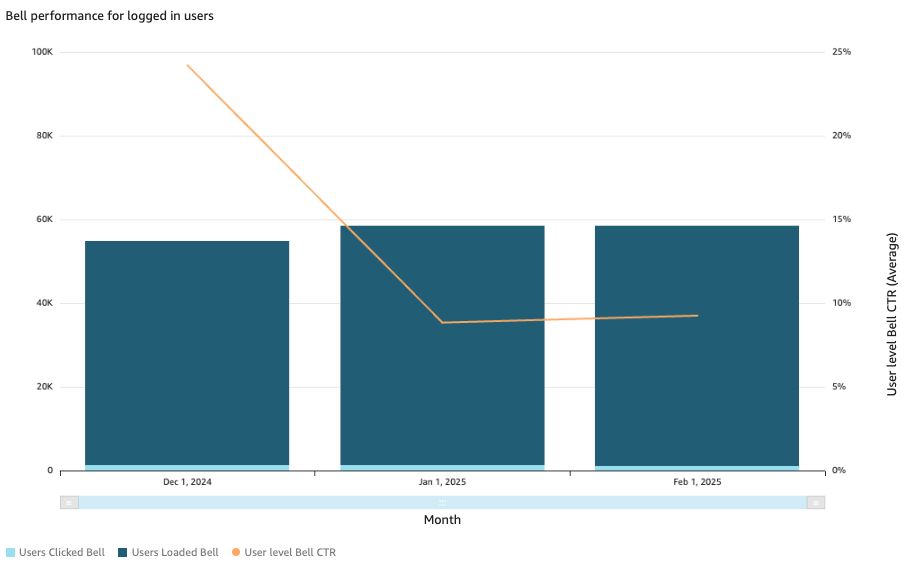
Monthly bell CTR based on loads vs clicks for logged in users
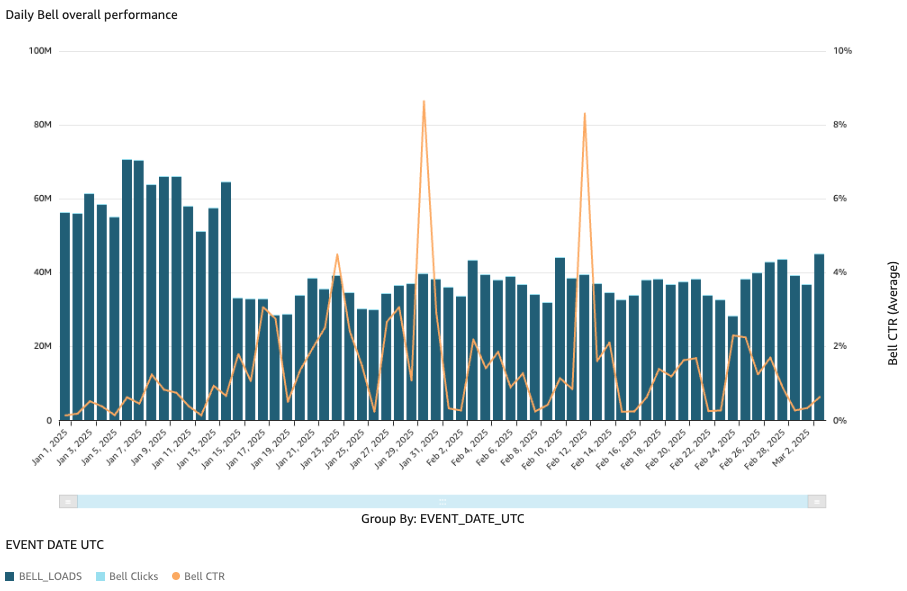
Daily bell CTR based on loads vs clicks for all users
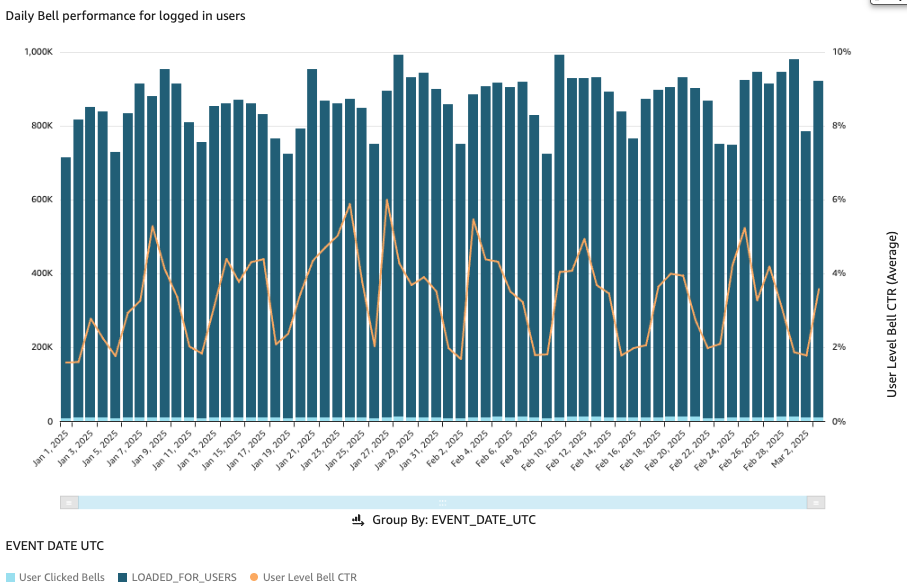
Daily bell CTR based on loads vs clicks for logged in users
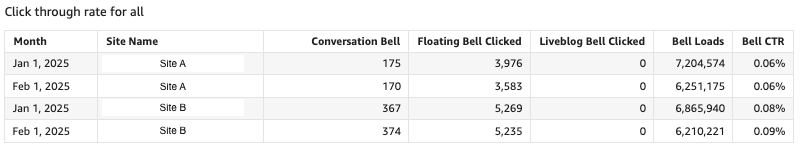
Monthly bell CTR for all sites under the client for all users
The bell performance is broken down by bell type
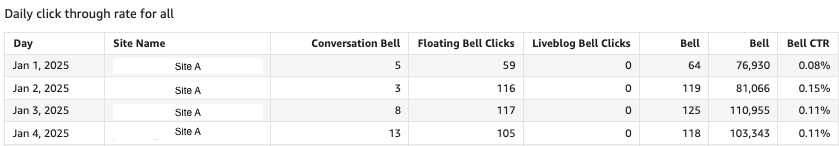
Daily bell CTR for all sites under the client for all users
The bell performance is broken down by bell type
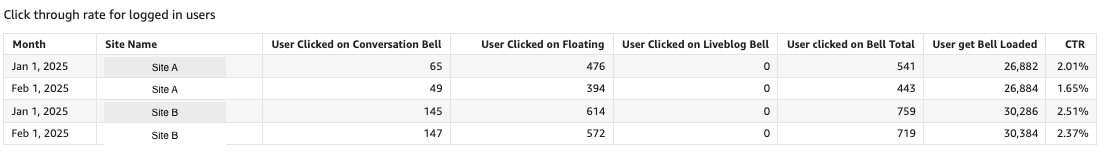
Monthly bell CTR for all sites under the client for all users
The bell performance is broken down by bell type
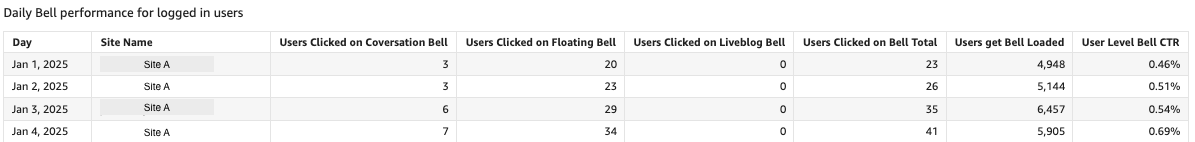
Daily bell CTR for all sites under the client for logged in users
The bell performance is broken down by bell type
Broadcast Notifications
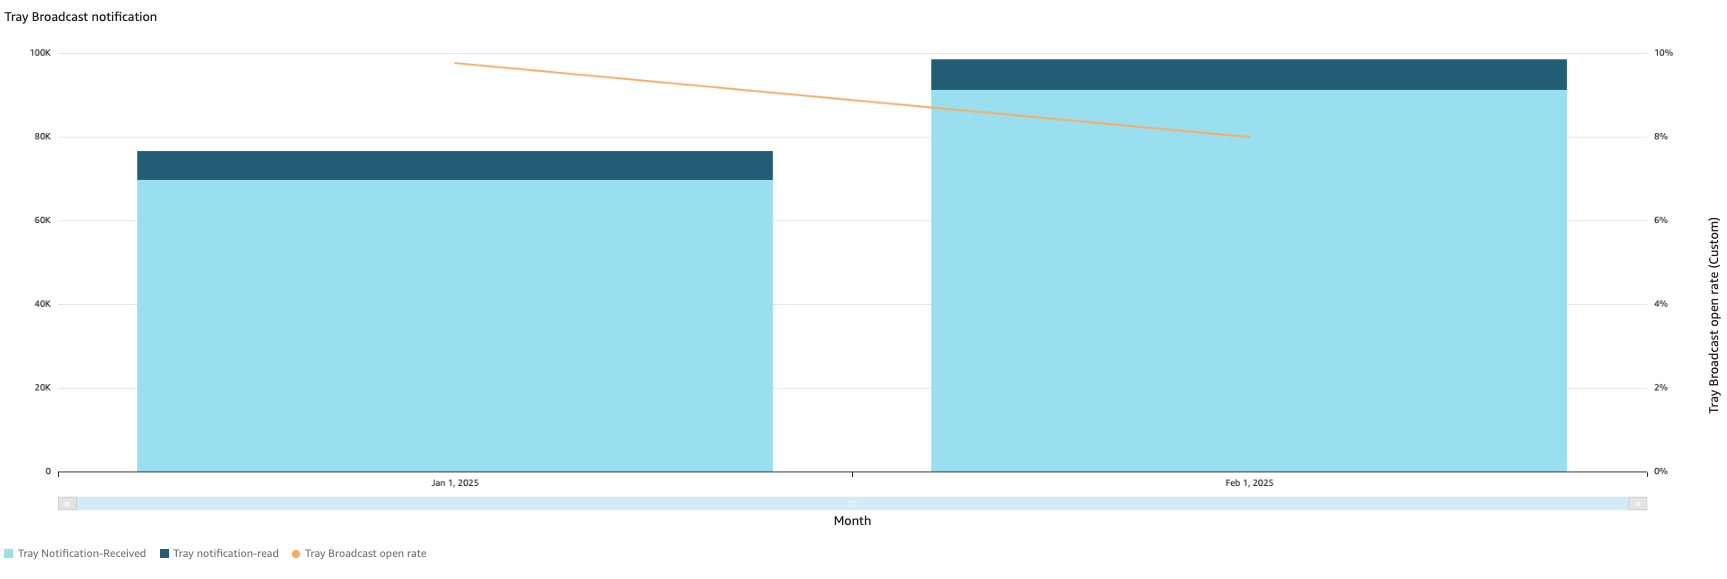
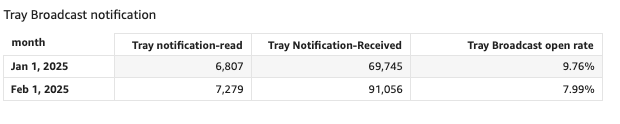
Open rate of broadcast notifications received in the tray
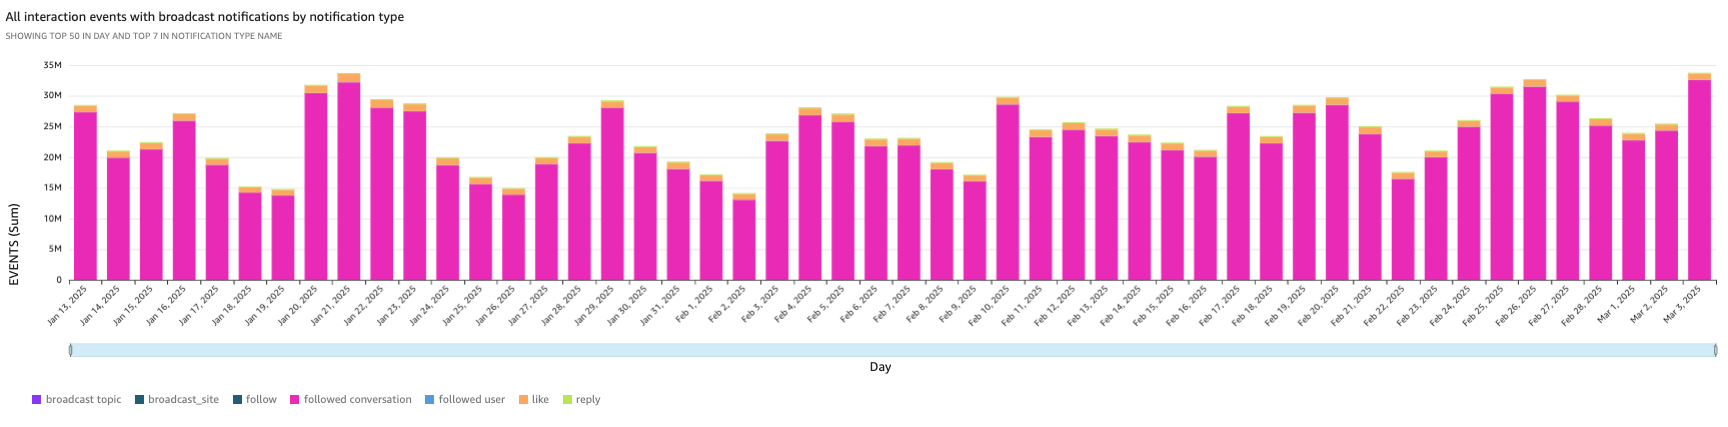
User Interactions with all broadcast notificatons
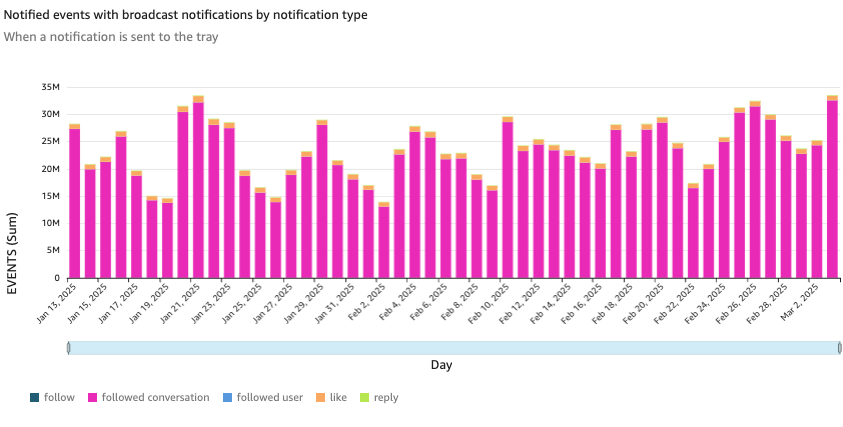
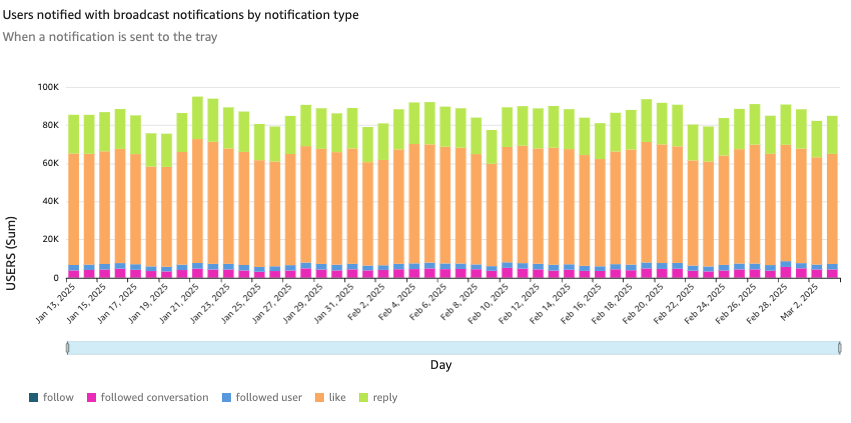
Notified events are notifications being sent to the tray
Every interaction sends an event e.g. 5 likes on a comment sends 5 notifications
Users receiving events
There will always be more events than users, a user will appear once per day regardless of how many notifications they have received
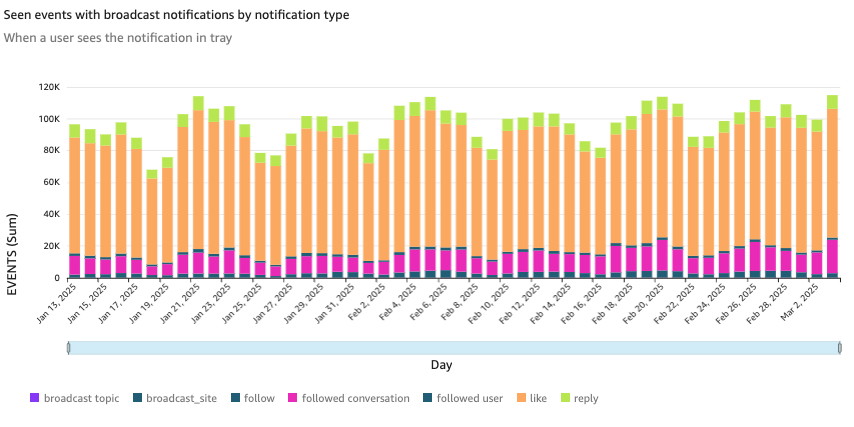
A "seen" event is counted when a user opens the tray and sees the notification
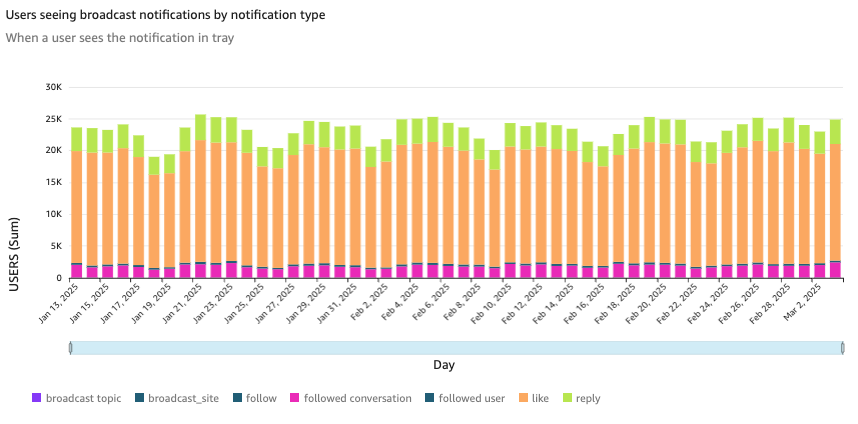
Users seeing the notifications in the tray
User is only counted once daily, even if they have multiple notifications
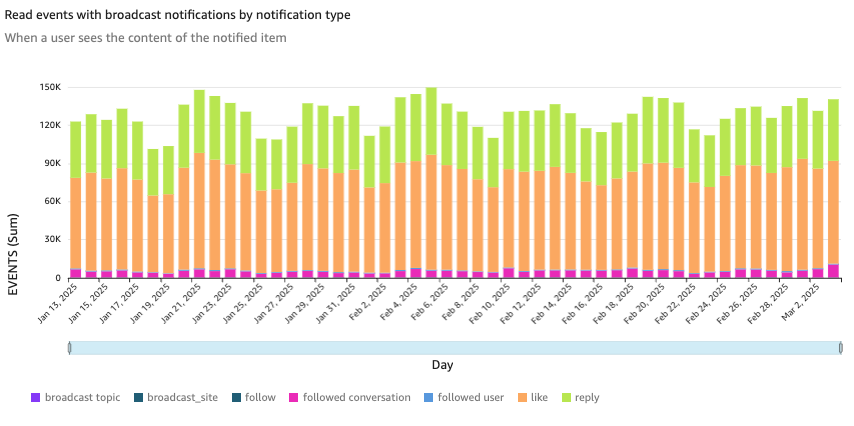
When the users sees the content they are notified about
This number can be high as users may have already seen the content they are notified about in the comment section before going to the tray (this counts as 2 read events)
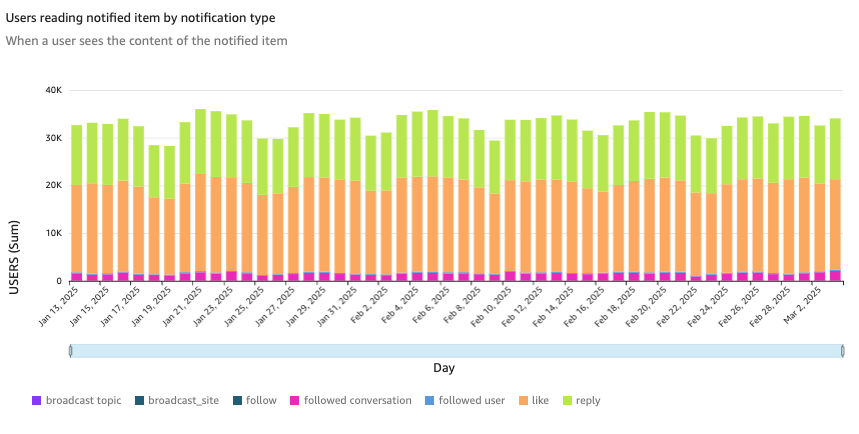
The users who have seen the content in the notifications
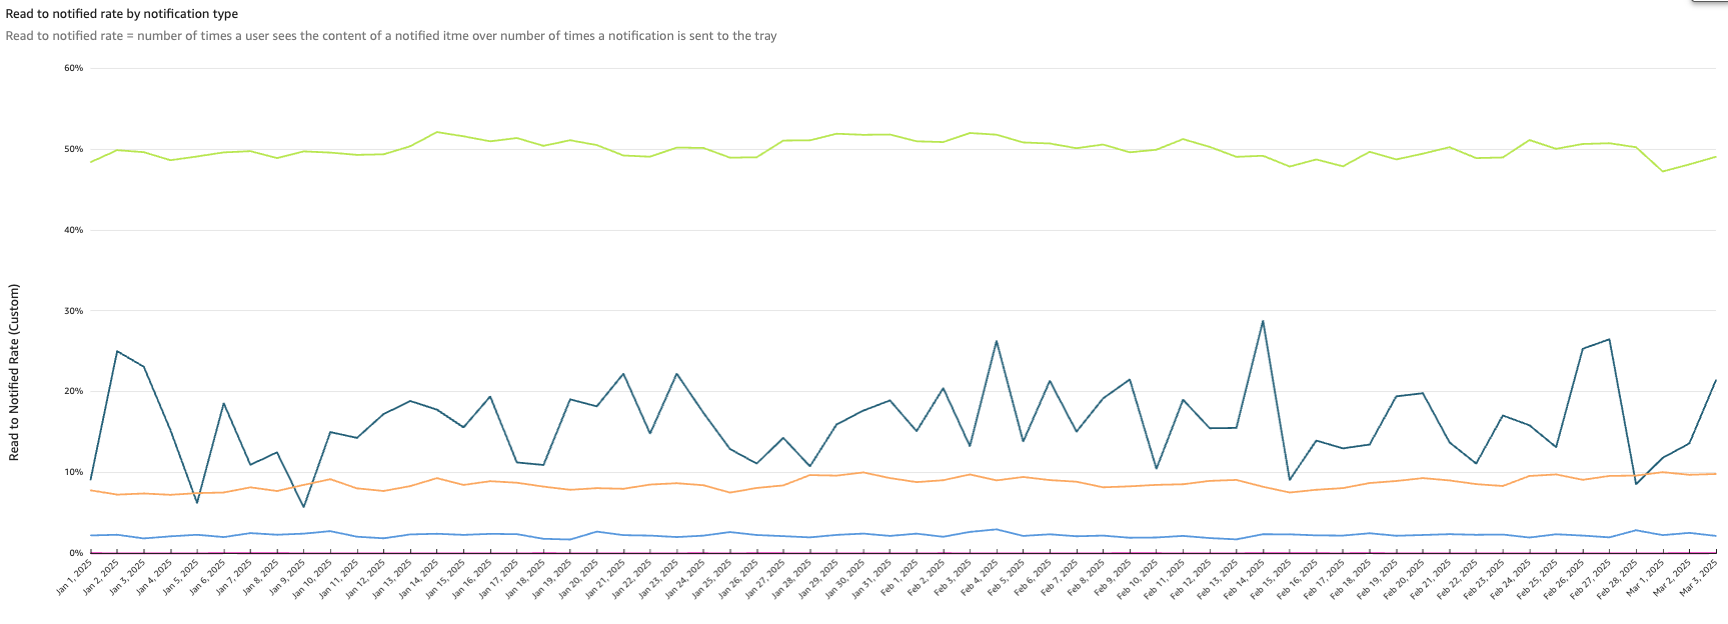
Number is usually 100%+ because users often see the event they are being notified about before going to the notification
e.g. if a user receives a reply to their comment, they may still be lingering on the comment section and this will count as a read event
E-mail Notifications
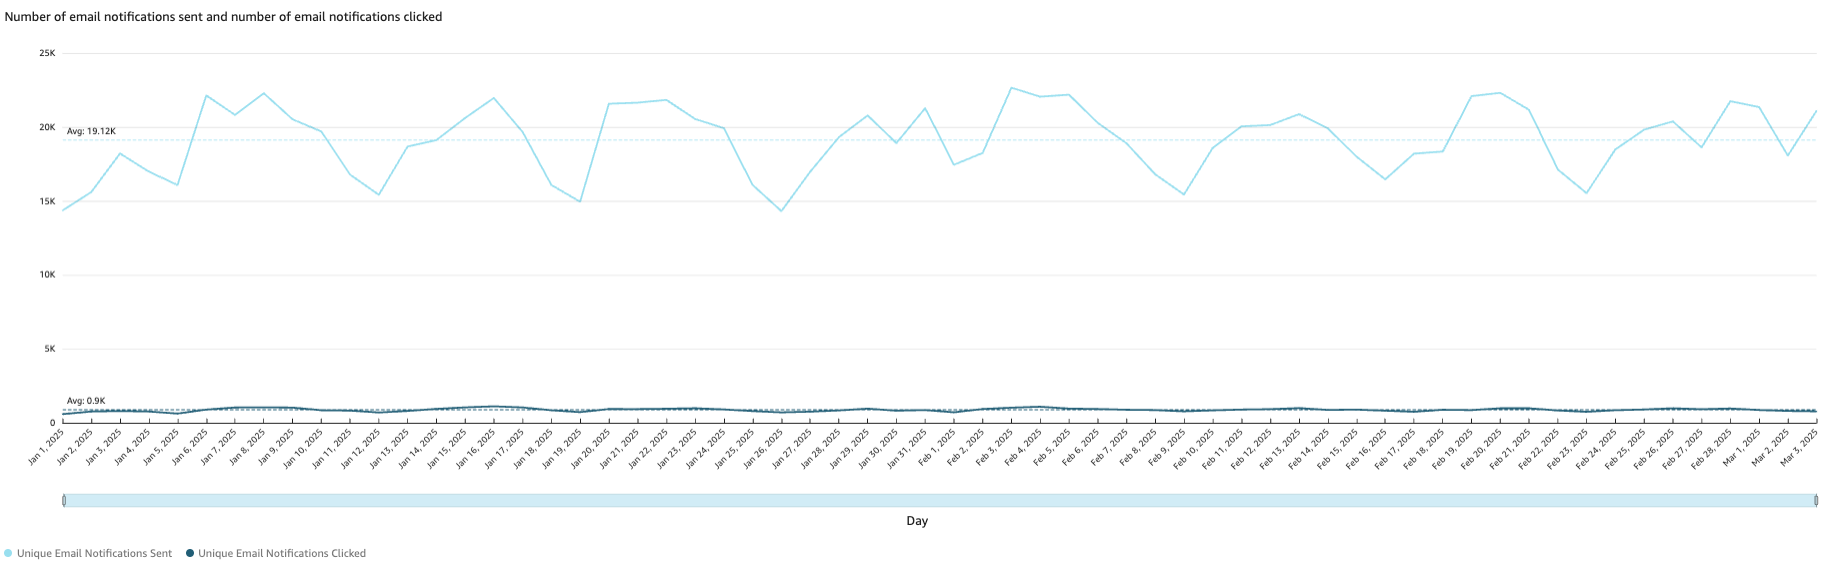
Data shows the date that the email was sent and the date that the email was clicked
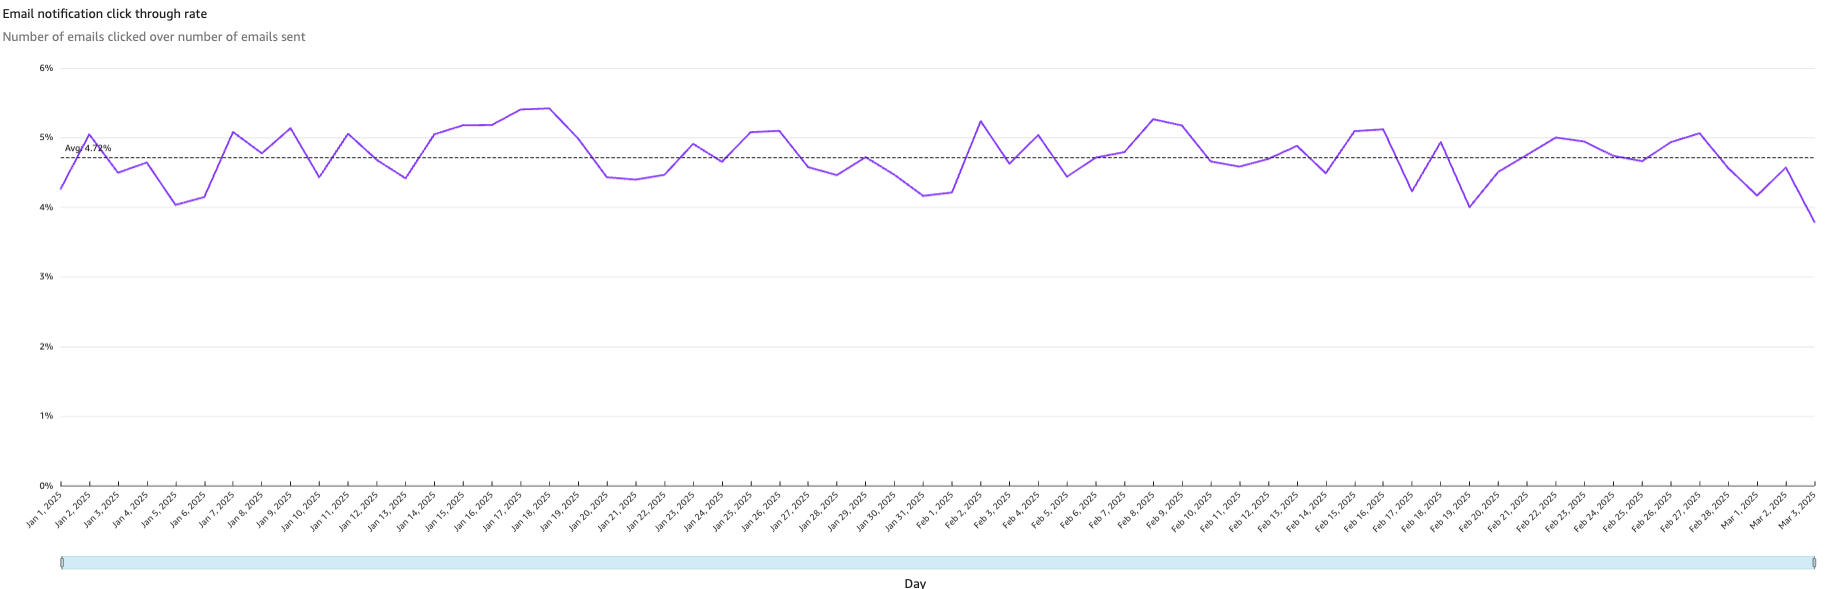
Number of emails clicked/Number of e-mails sent
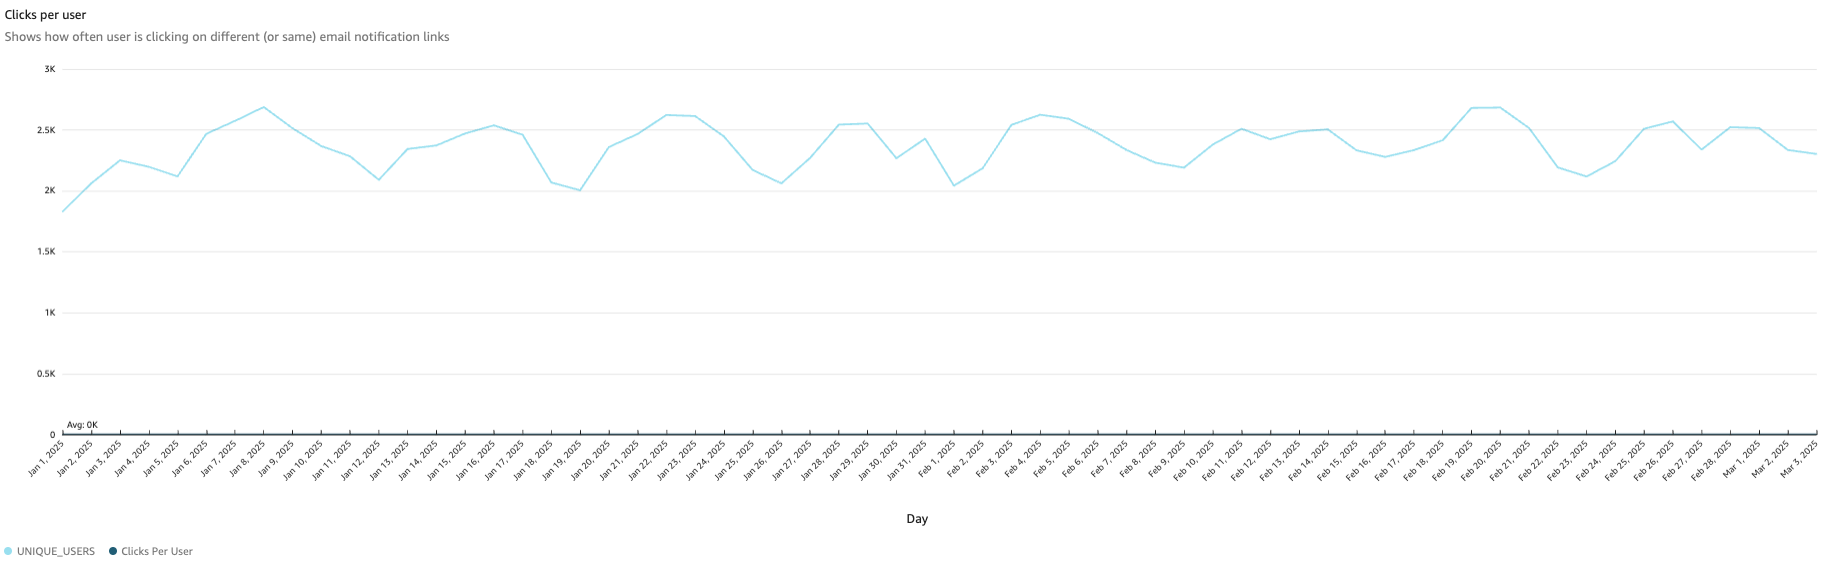
How many clicks per user on e-mail notifications
Topic Follows
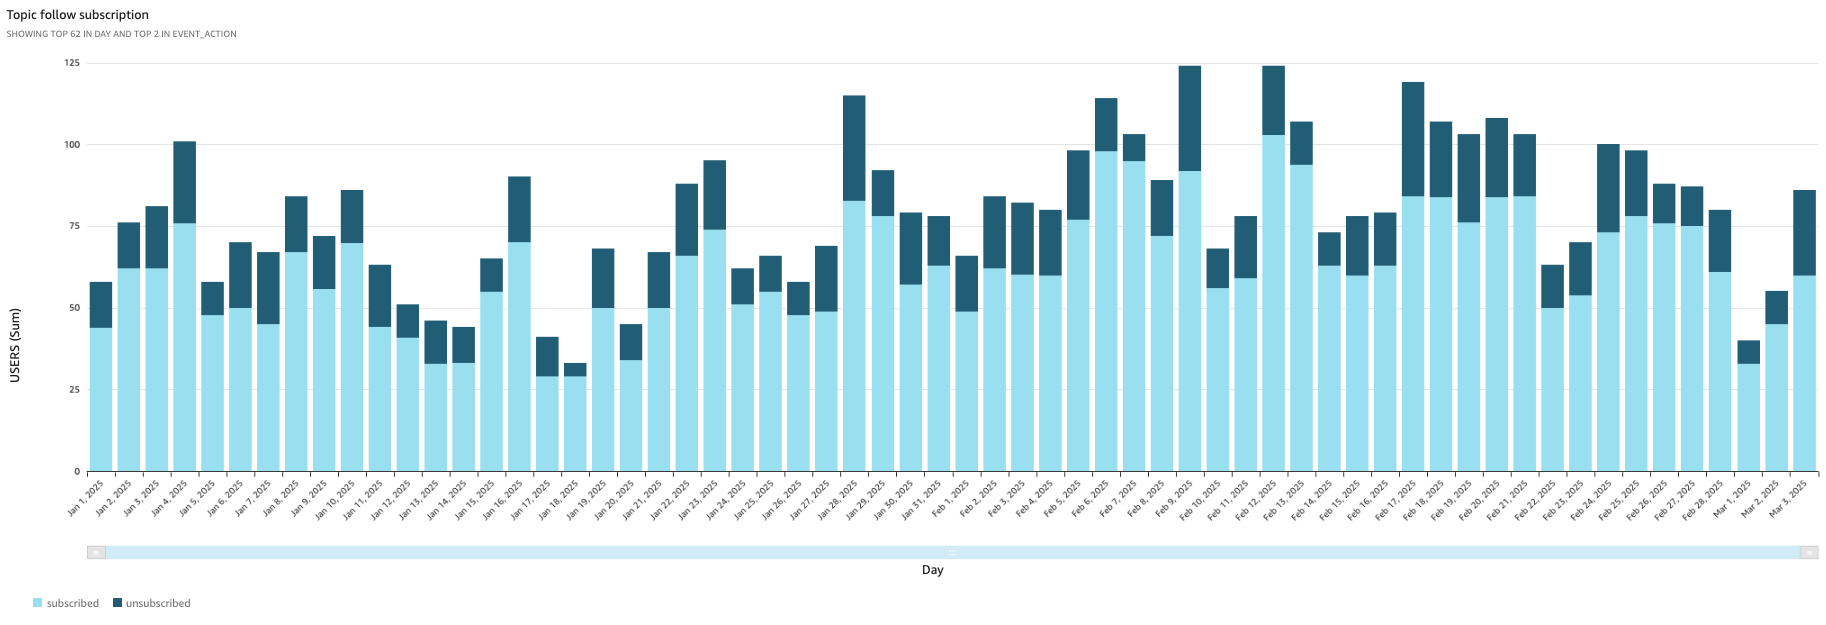
Counting subscribed and unsubscribed events
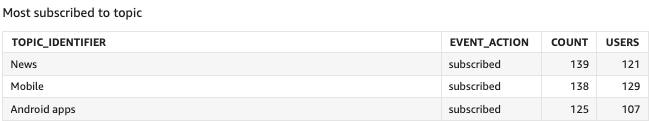
Topics that currently have the most subscribed users
Sharebars
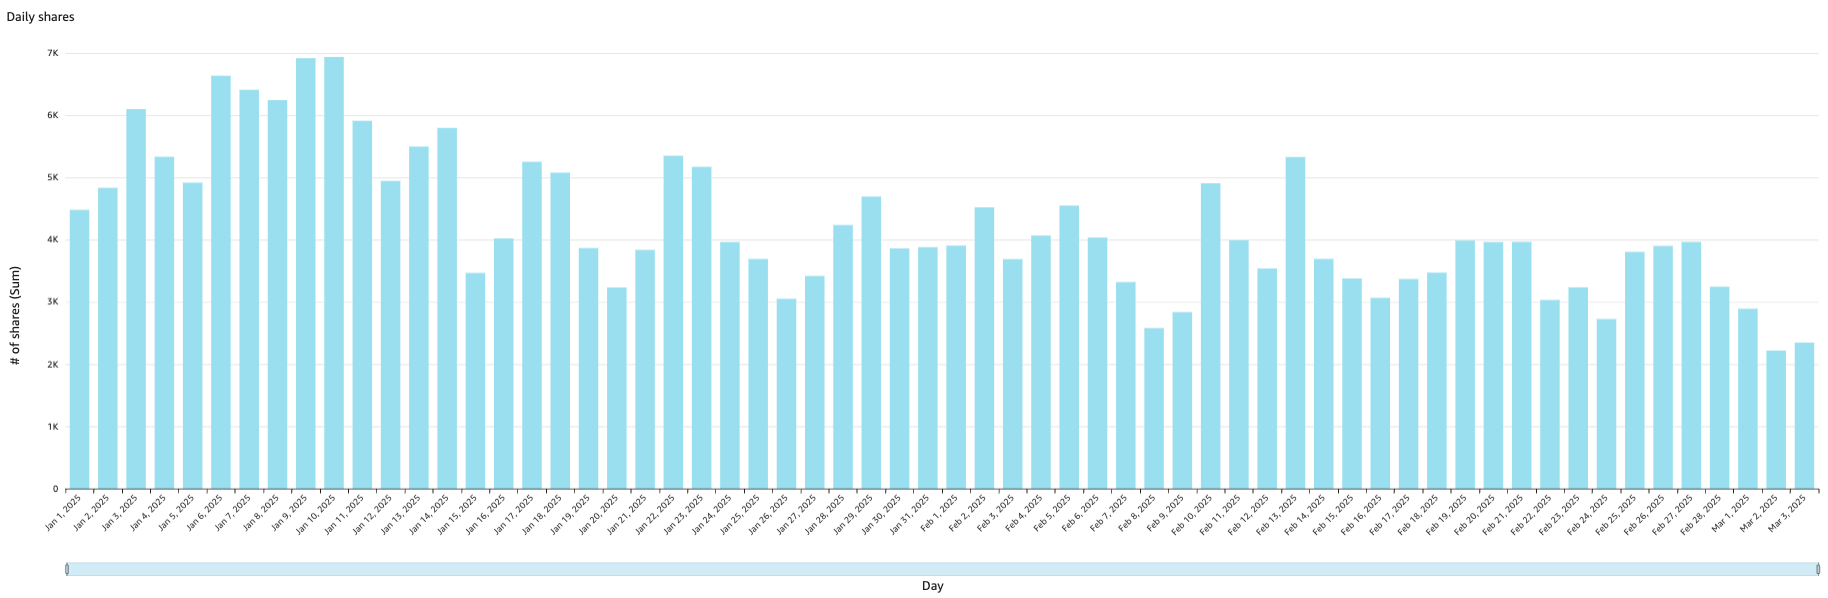
Number of shares per day using Viafoura's sharebar
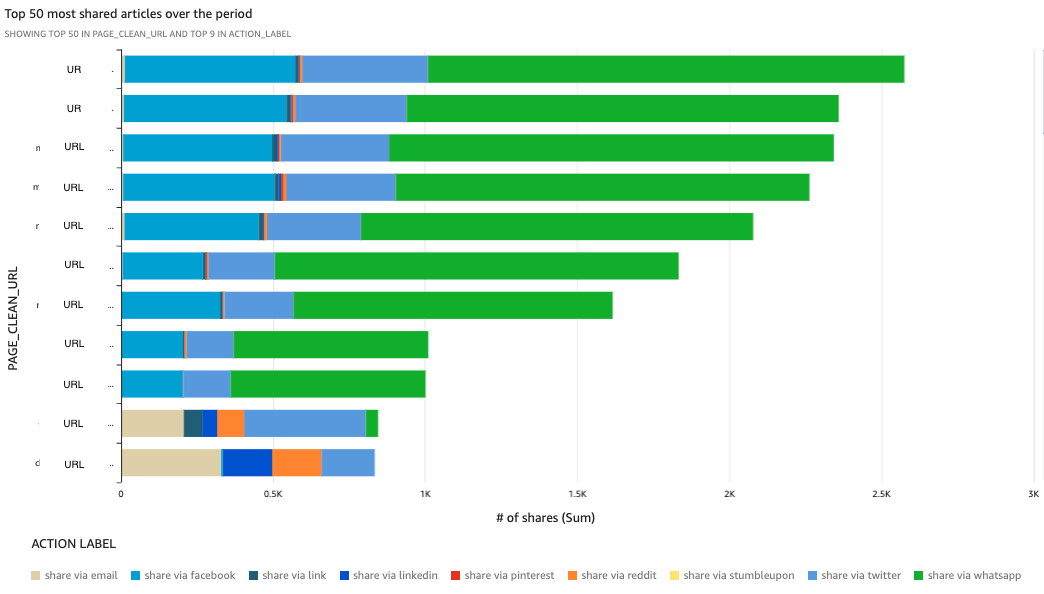
Most shared articles by share channel
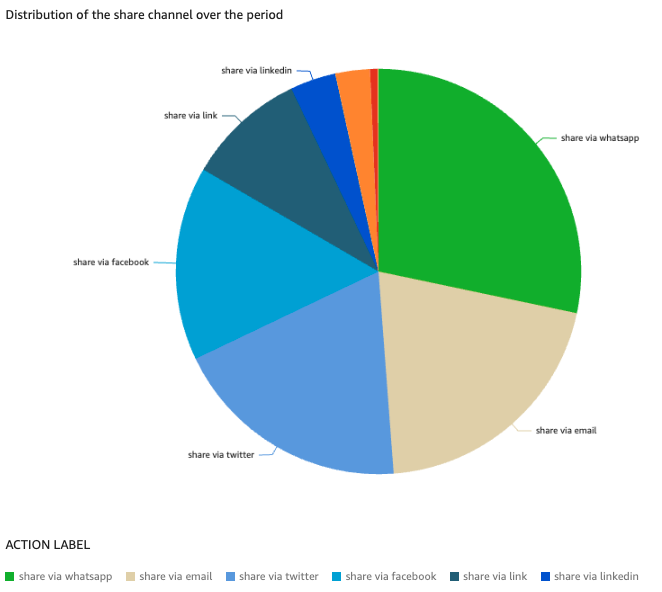
Most shared channel
Calculated by using URL parameters
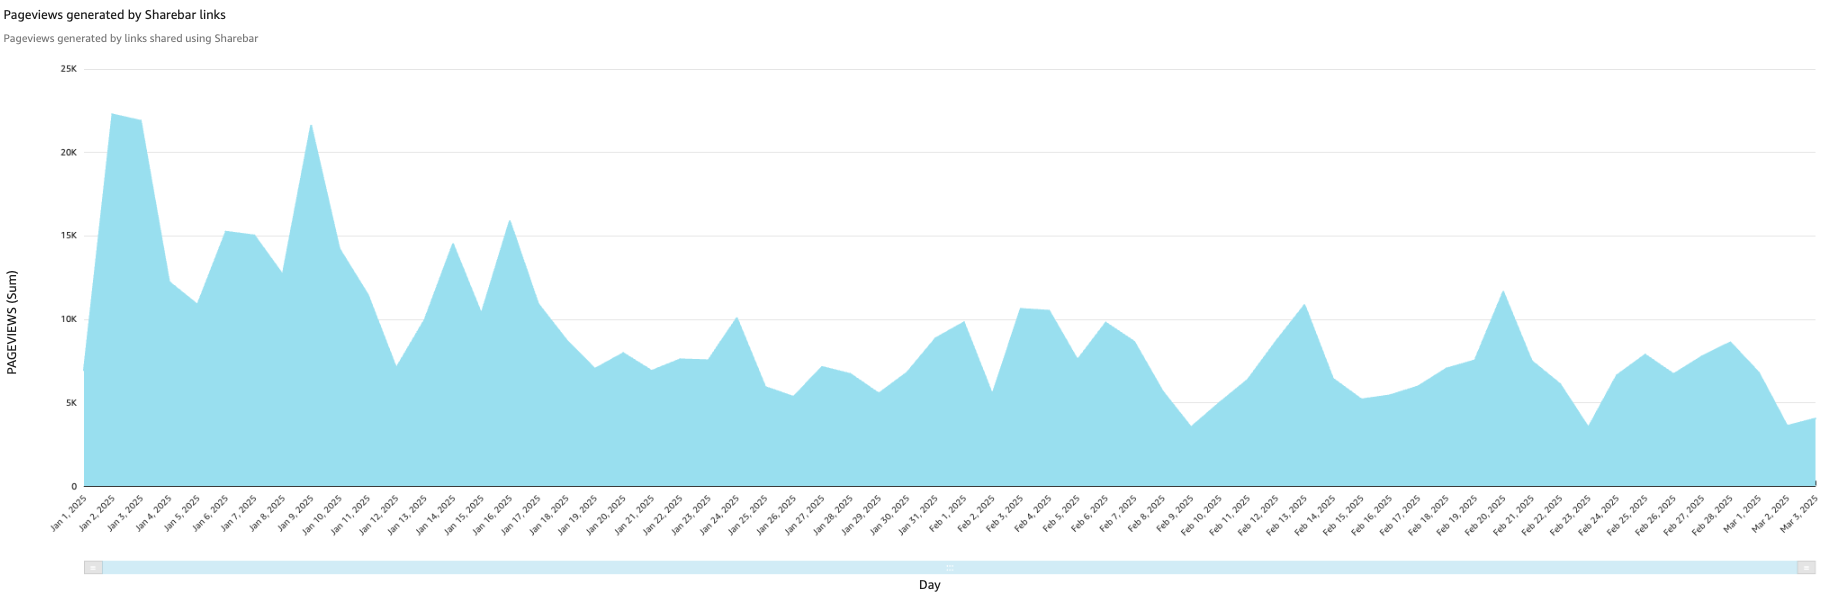
We only track the 1st PV after the user has visited the site
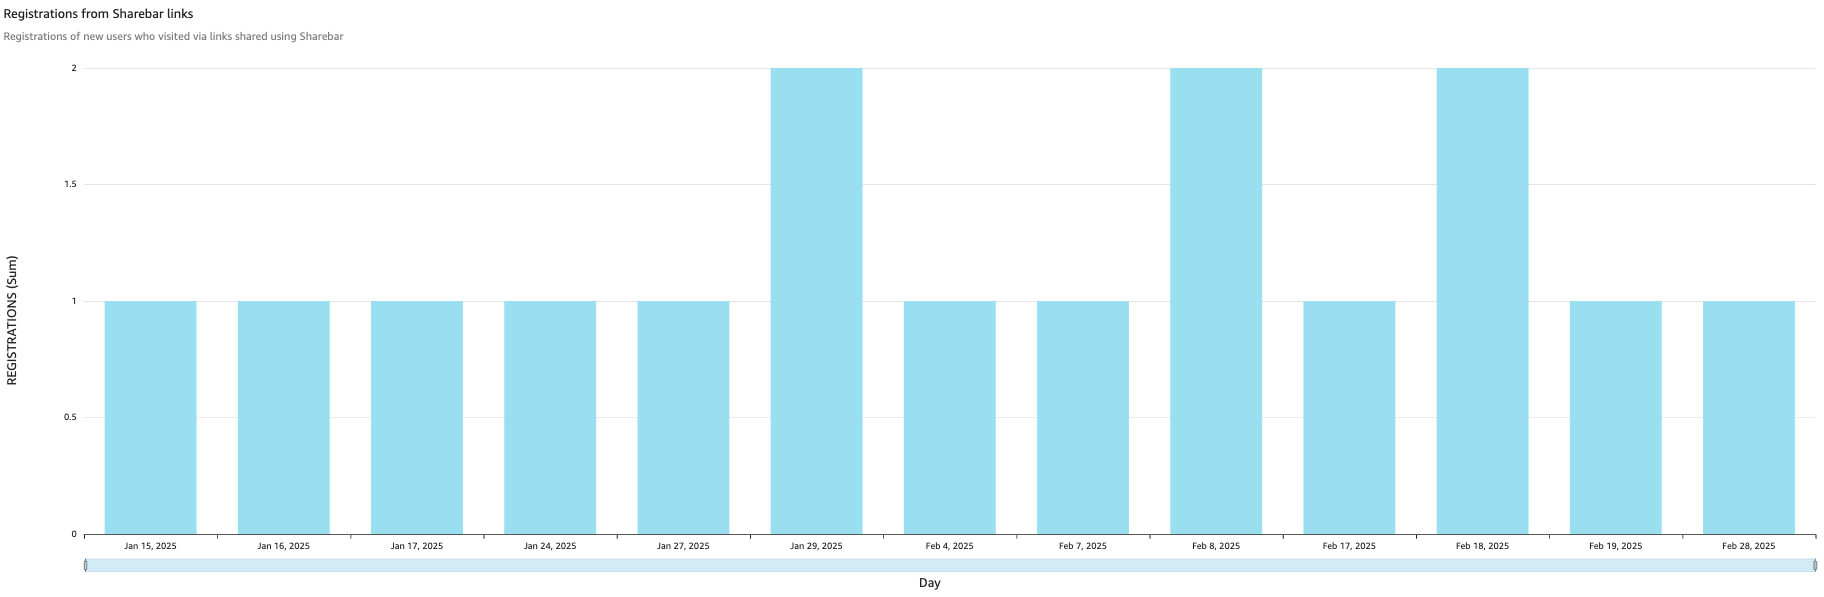
Capturing registrations that happen after a user has interacted with the Sharebar
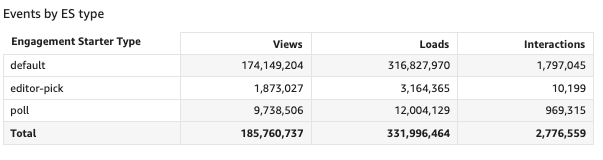
Engagement Starter
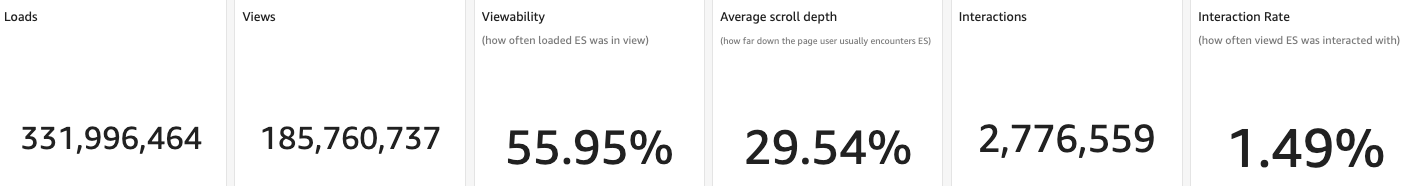
Snapshot of usage, performance and positioning on page
Avg Scroll depth: Every event sends the page/scroll depth of the event
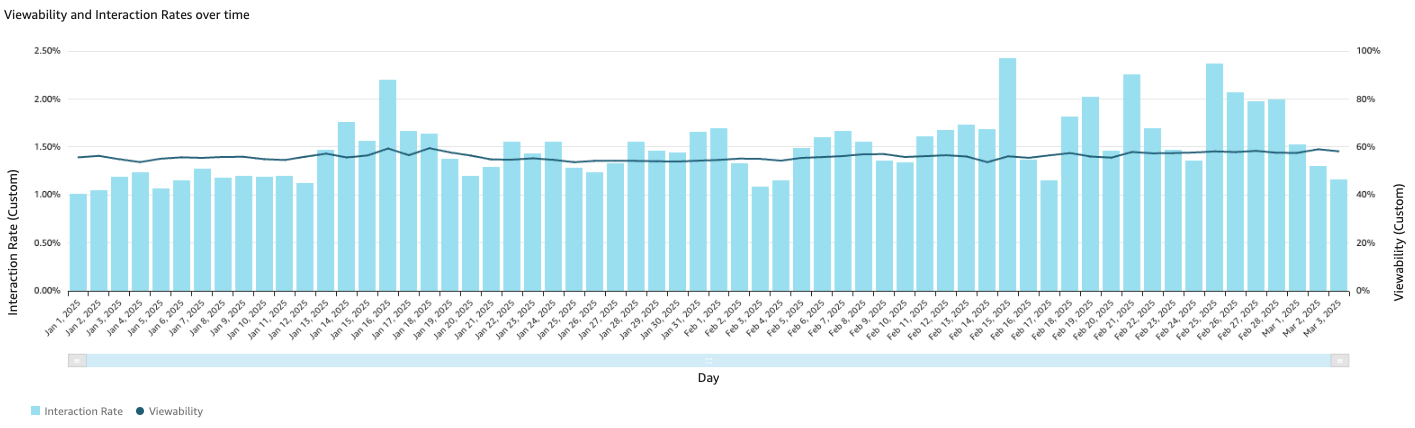
Showing how often the ES was in view and how often it was interacted with, across all Engagement starter views (Default, Featured comment, Poll)
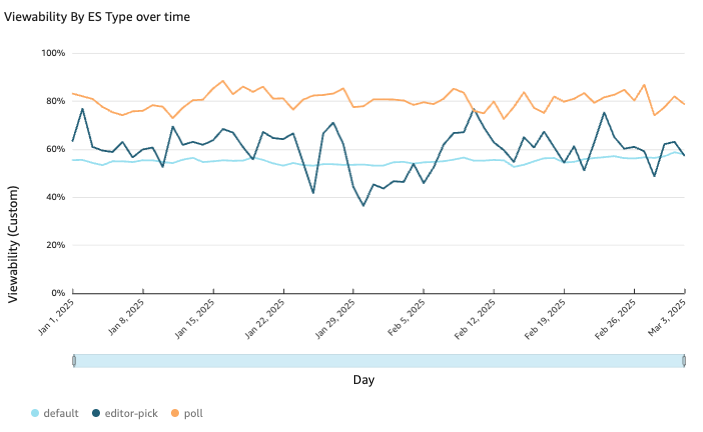
How often the loaded ES was in view broken down by Type
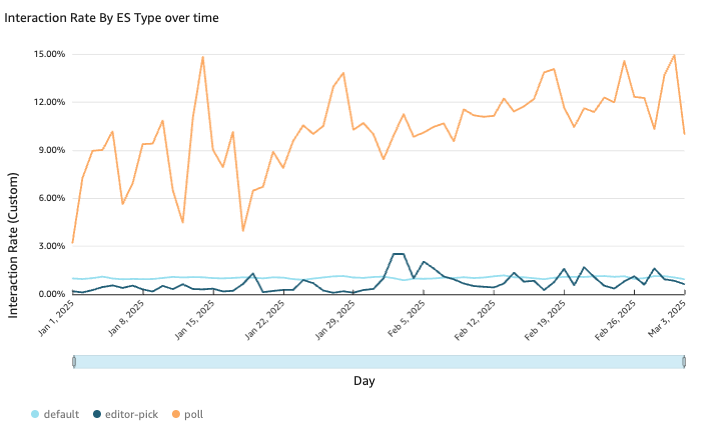
How often was the Engagement Starter interacted with
Polls have the highest engagement rate
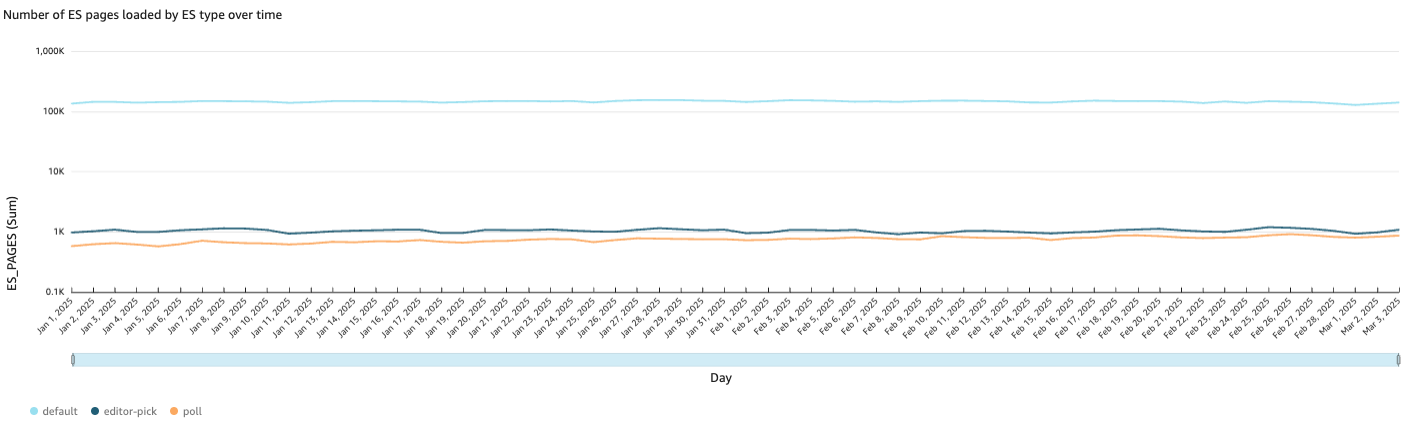
How often is the Engagement Starter being added to the pages and what type of Engagement Starter is being used.
Polls
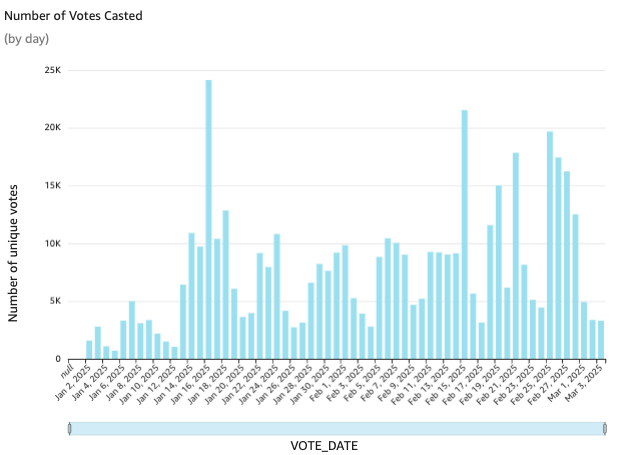
Daily votes casted in polls
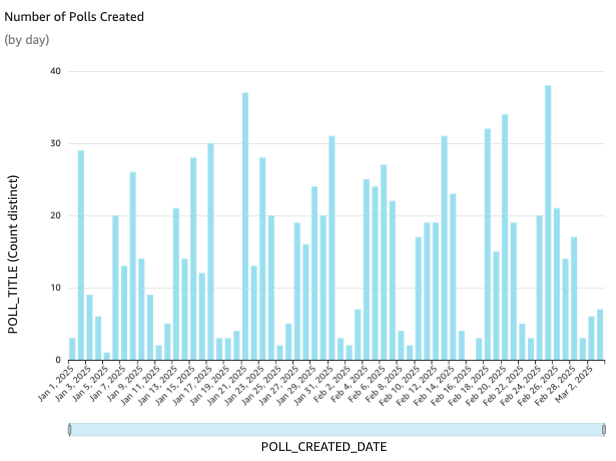
Polls created by day
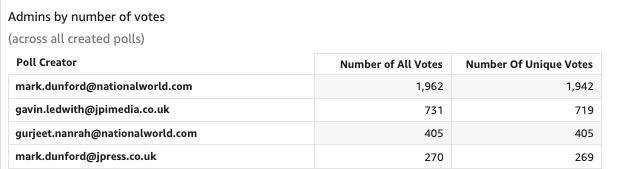
Poll creators who have received the most votes in their polls
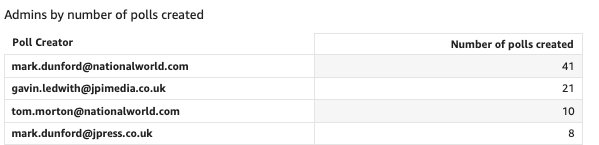
Number of individual polls created
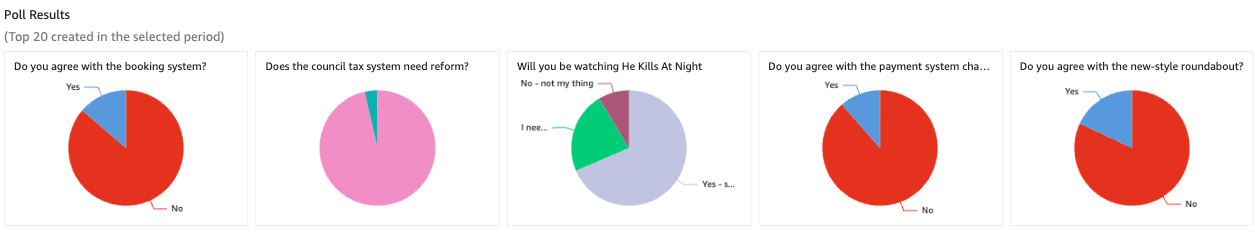
Top performing polls and results snapshot
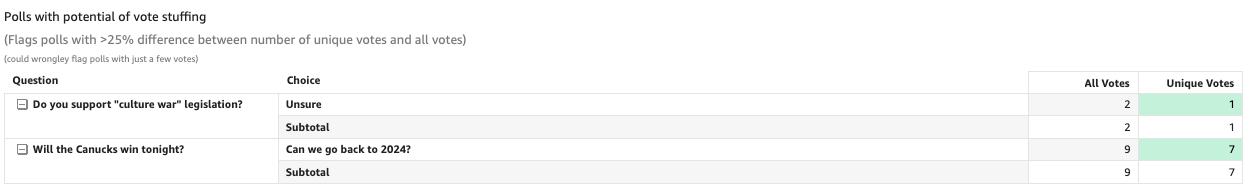
Polls with potential vote stuffing
For polls we currently count the number of voting events and unique votes we count using Cookie IDs - discrepancies can highlight any potential vote stuffing
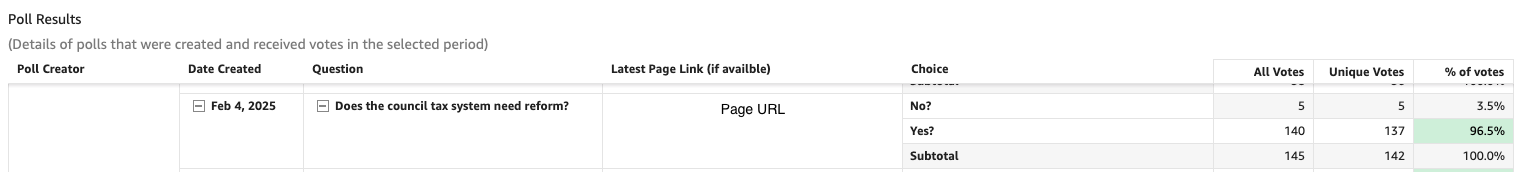
Polls created and their votes over a set period of time
Use this to analyze what works well - sports, politics, entertainment
Page Performance
Ensure you remove the http:// from the URL when adding the filters
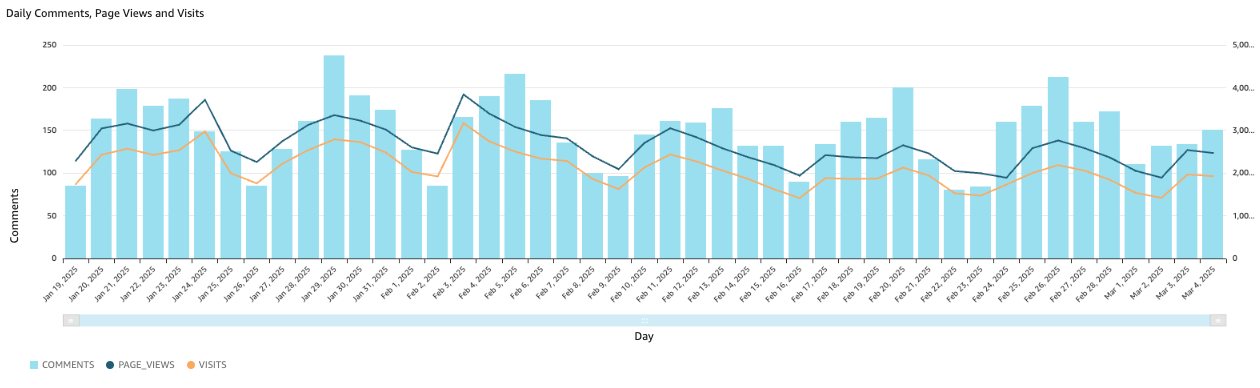
Comments, PVs and Visits for the specific article or campaign
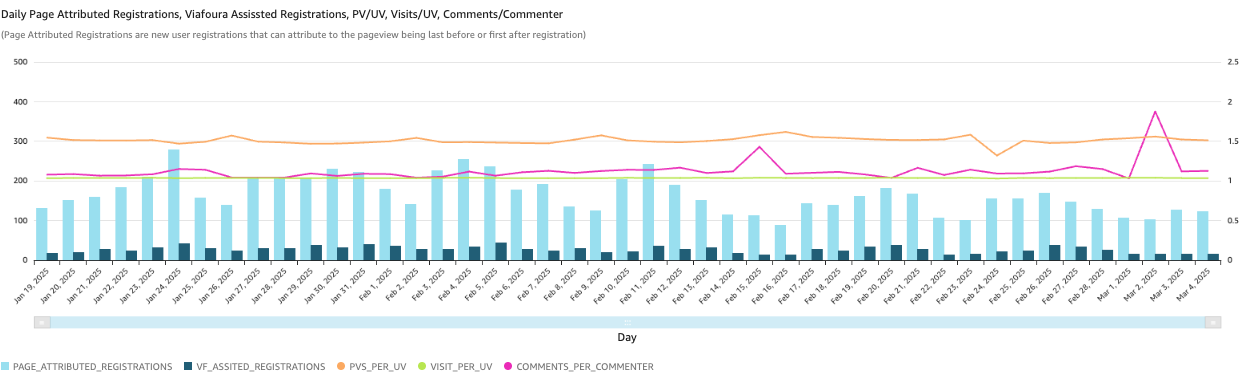
Registrations attributed to the URL and engagement metrics for the specific page

Data for campaigns

Data for URLs
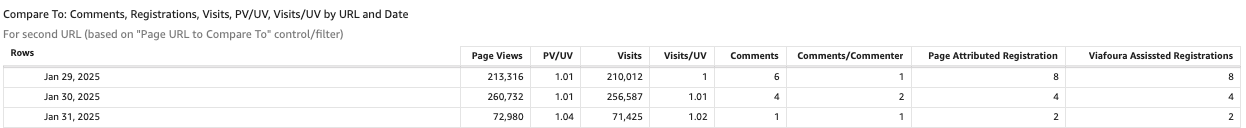
the URL you would like to compare it to
SDK

Ratings and Reviews
Viafoura's Ratings and Reviews feature

Comments posted in Viafoura ratings and reviews
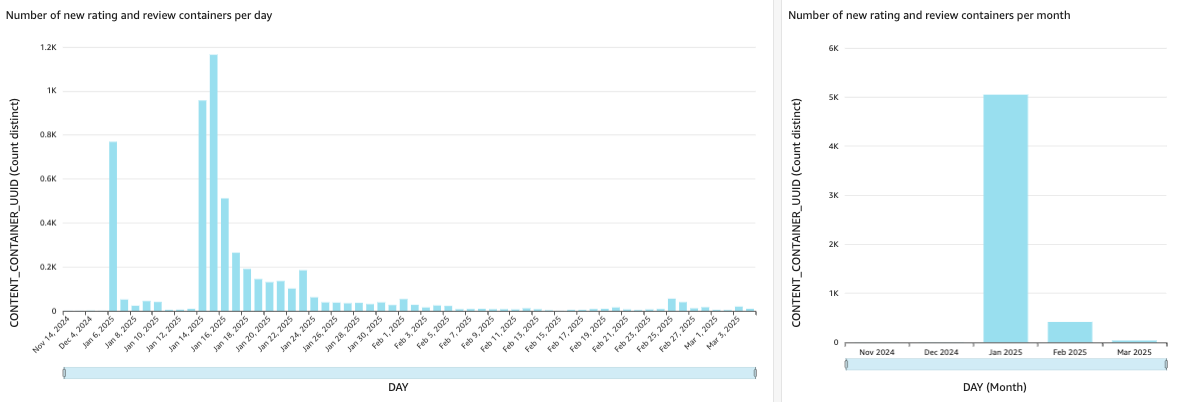
Number of new Ratings and Reviews containers created
Access to Quicksight
- Reach out to your dedicated CSM or [email protected] if you require access to Quicksight
- Access can take ~1 week to be granted
- When logging in ensure the Account Name is viafoura-production the User Name will be your email address
Important Notes
- All times are in UTC
- All data can be exported using the kebab menu in the top right of each graph
- Most graphs have data from 6 months - 12 months to ensure long-term access, we recommend downloading any data you need for perpetuity
- We do offer raw data ingest which will allow you to bring this data internally and integrate it into your own analytics/visualization tools
- Some graphs will say "No data" this means you are not currently using this feature, if you think you're receiving this message in error please reach out to your dedicated CSM
Updated 3 months ago